Ayobi, Hossein - Hövel, Alexander - Sheha, Mohamed
Soundscape Wandsbek Markt
Wandsbek Markt is one of Hamburg's busiest traffic hubs in the east of the city, where several major roads and two Magistralen (M7 x M11) meet. It is also a central interchange for buses and the U-Bahn. On our field trip the whole area felt like a storm. More precisely, a sound storm. That is why we chose noise and sound reduction as our topic. It sits right at the intersection of our three disciplines civil engineering, urban planning and hydrography.
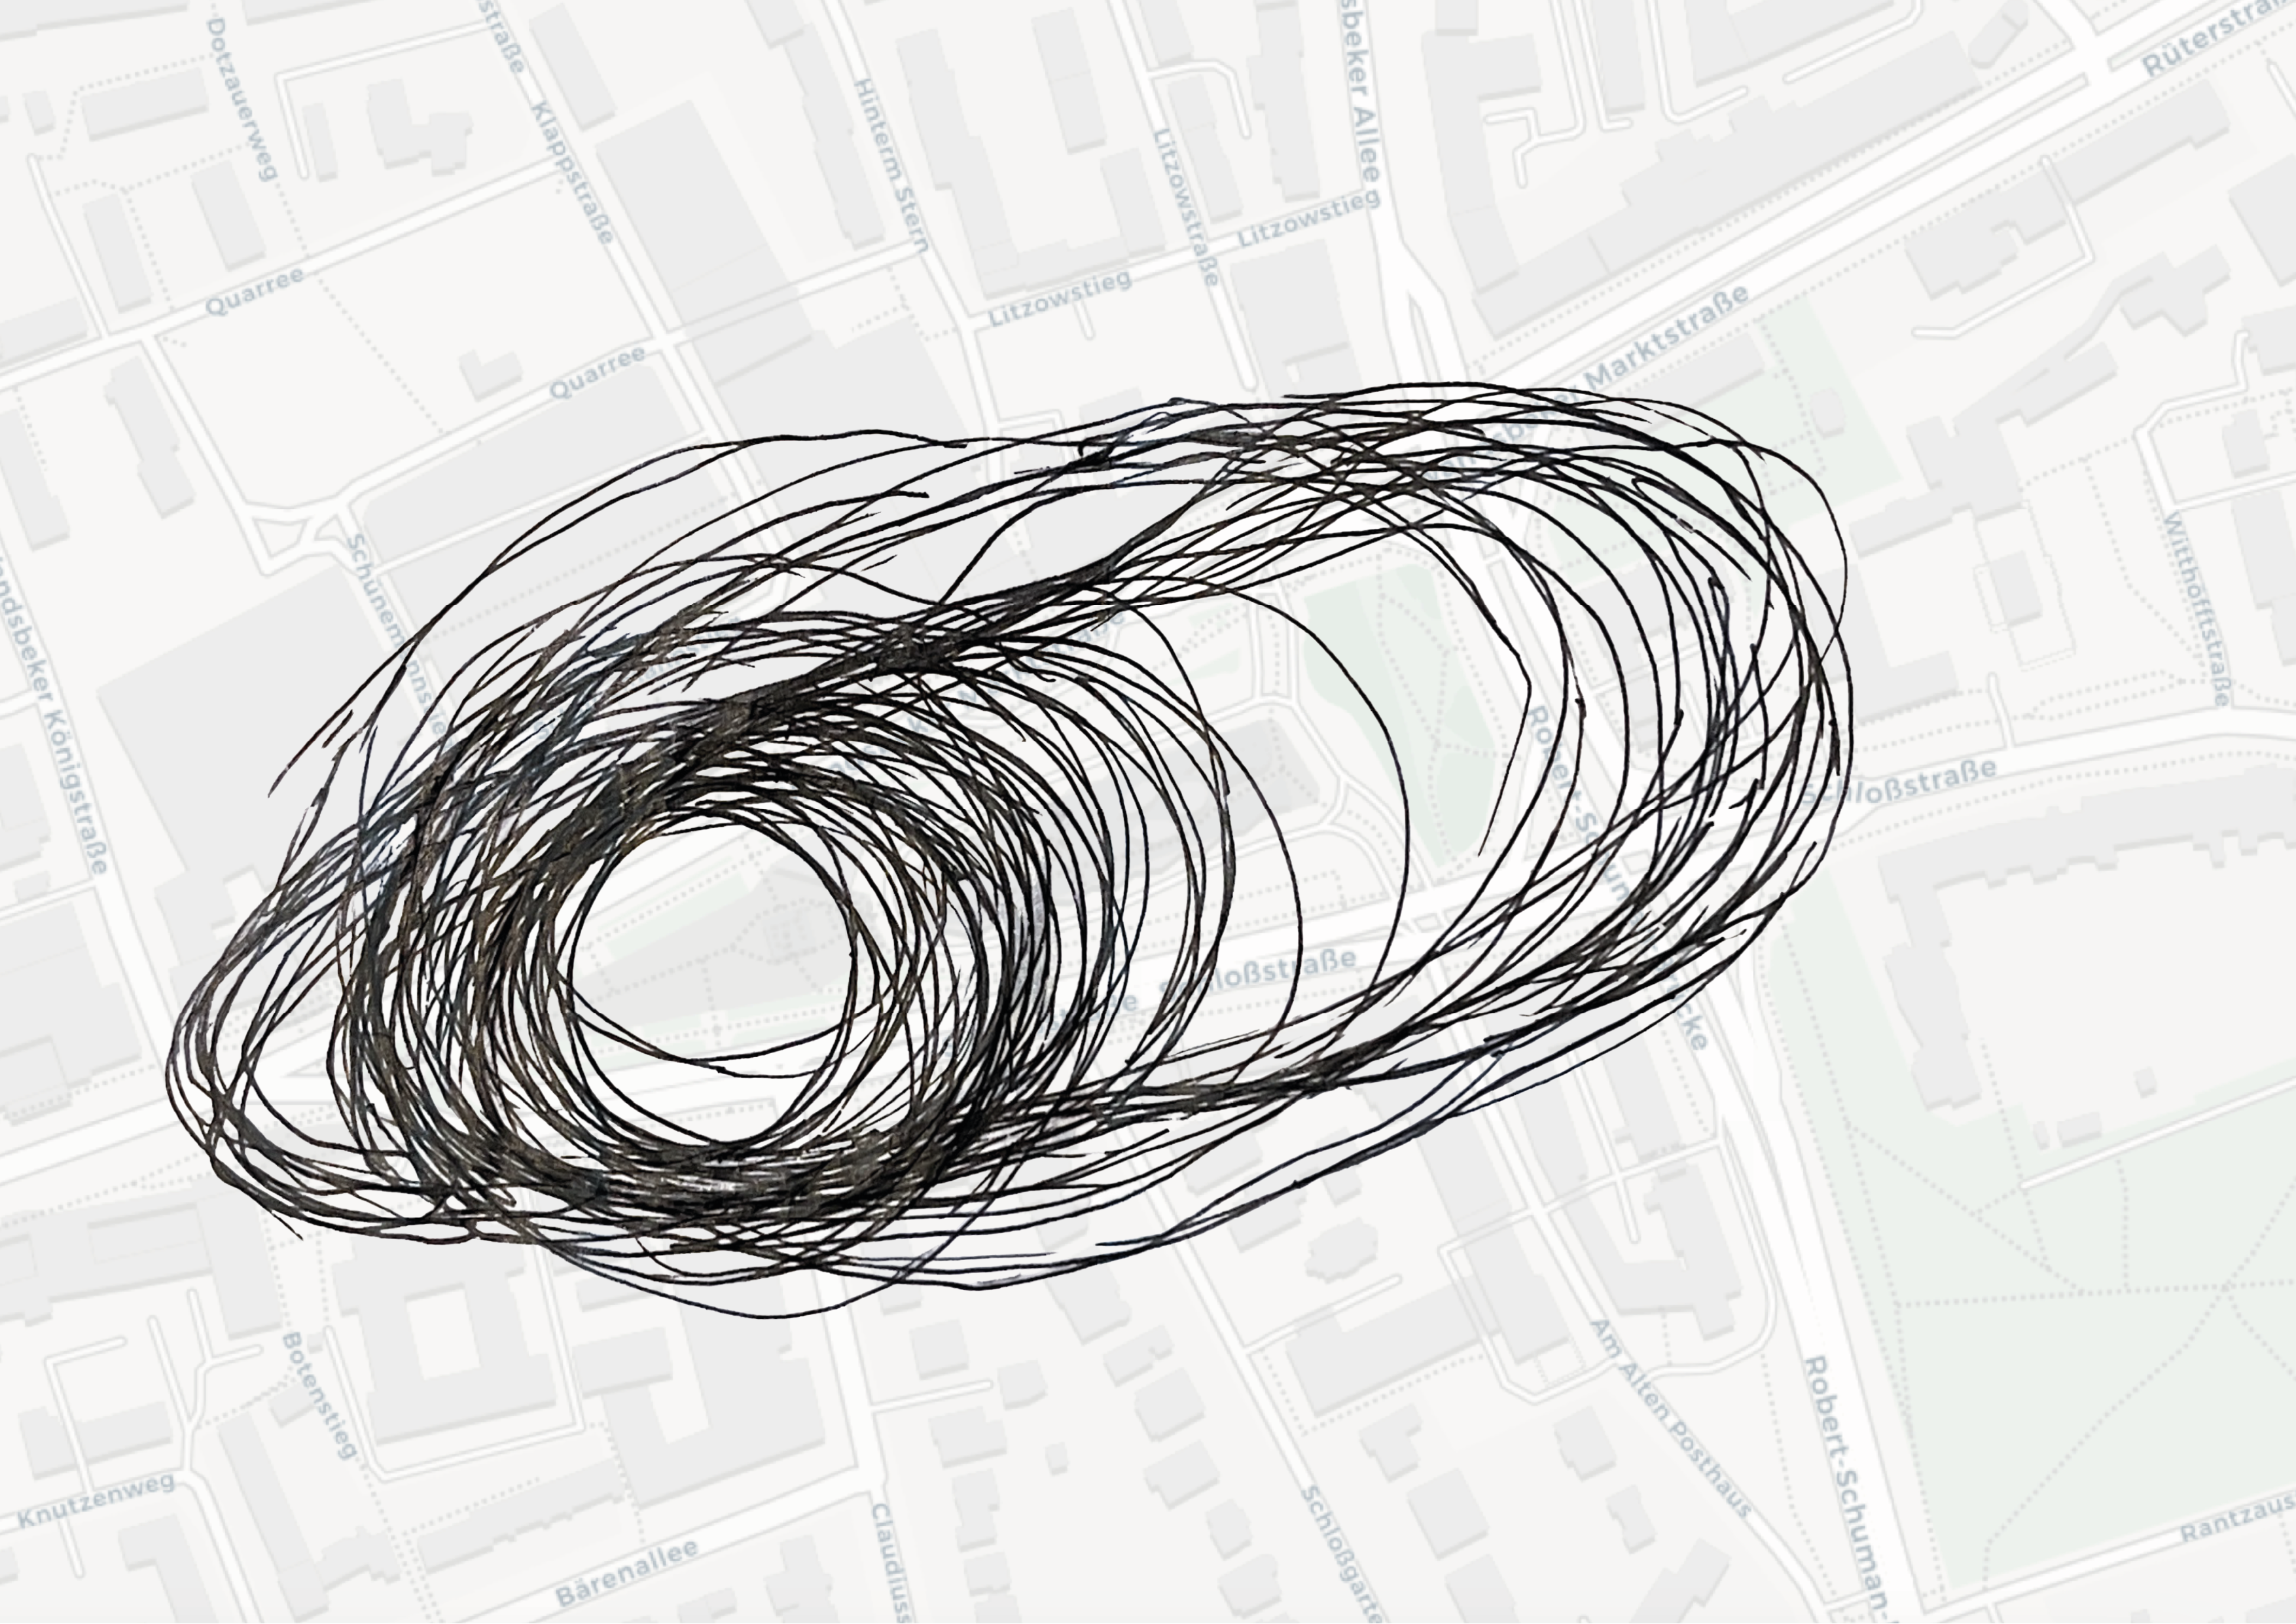
Options when facing a storm
FYI: Normally, when a storm comes your way, your first reaction should be to try to get out of its path. Planners though rarely get that luxury. The city keeps throwing tricky situations at you, and there is always more than one way to react. So instead of running, we decided to calm the storm and look for its eye. Those small, unexpected pockets of calm can turn out to be surprisingly interesting.
Now, Is Wandsbek Markt actually one big soundstorm?
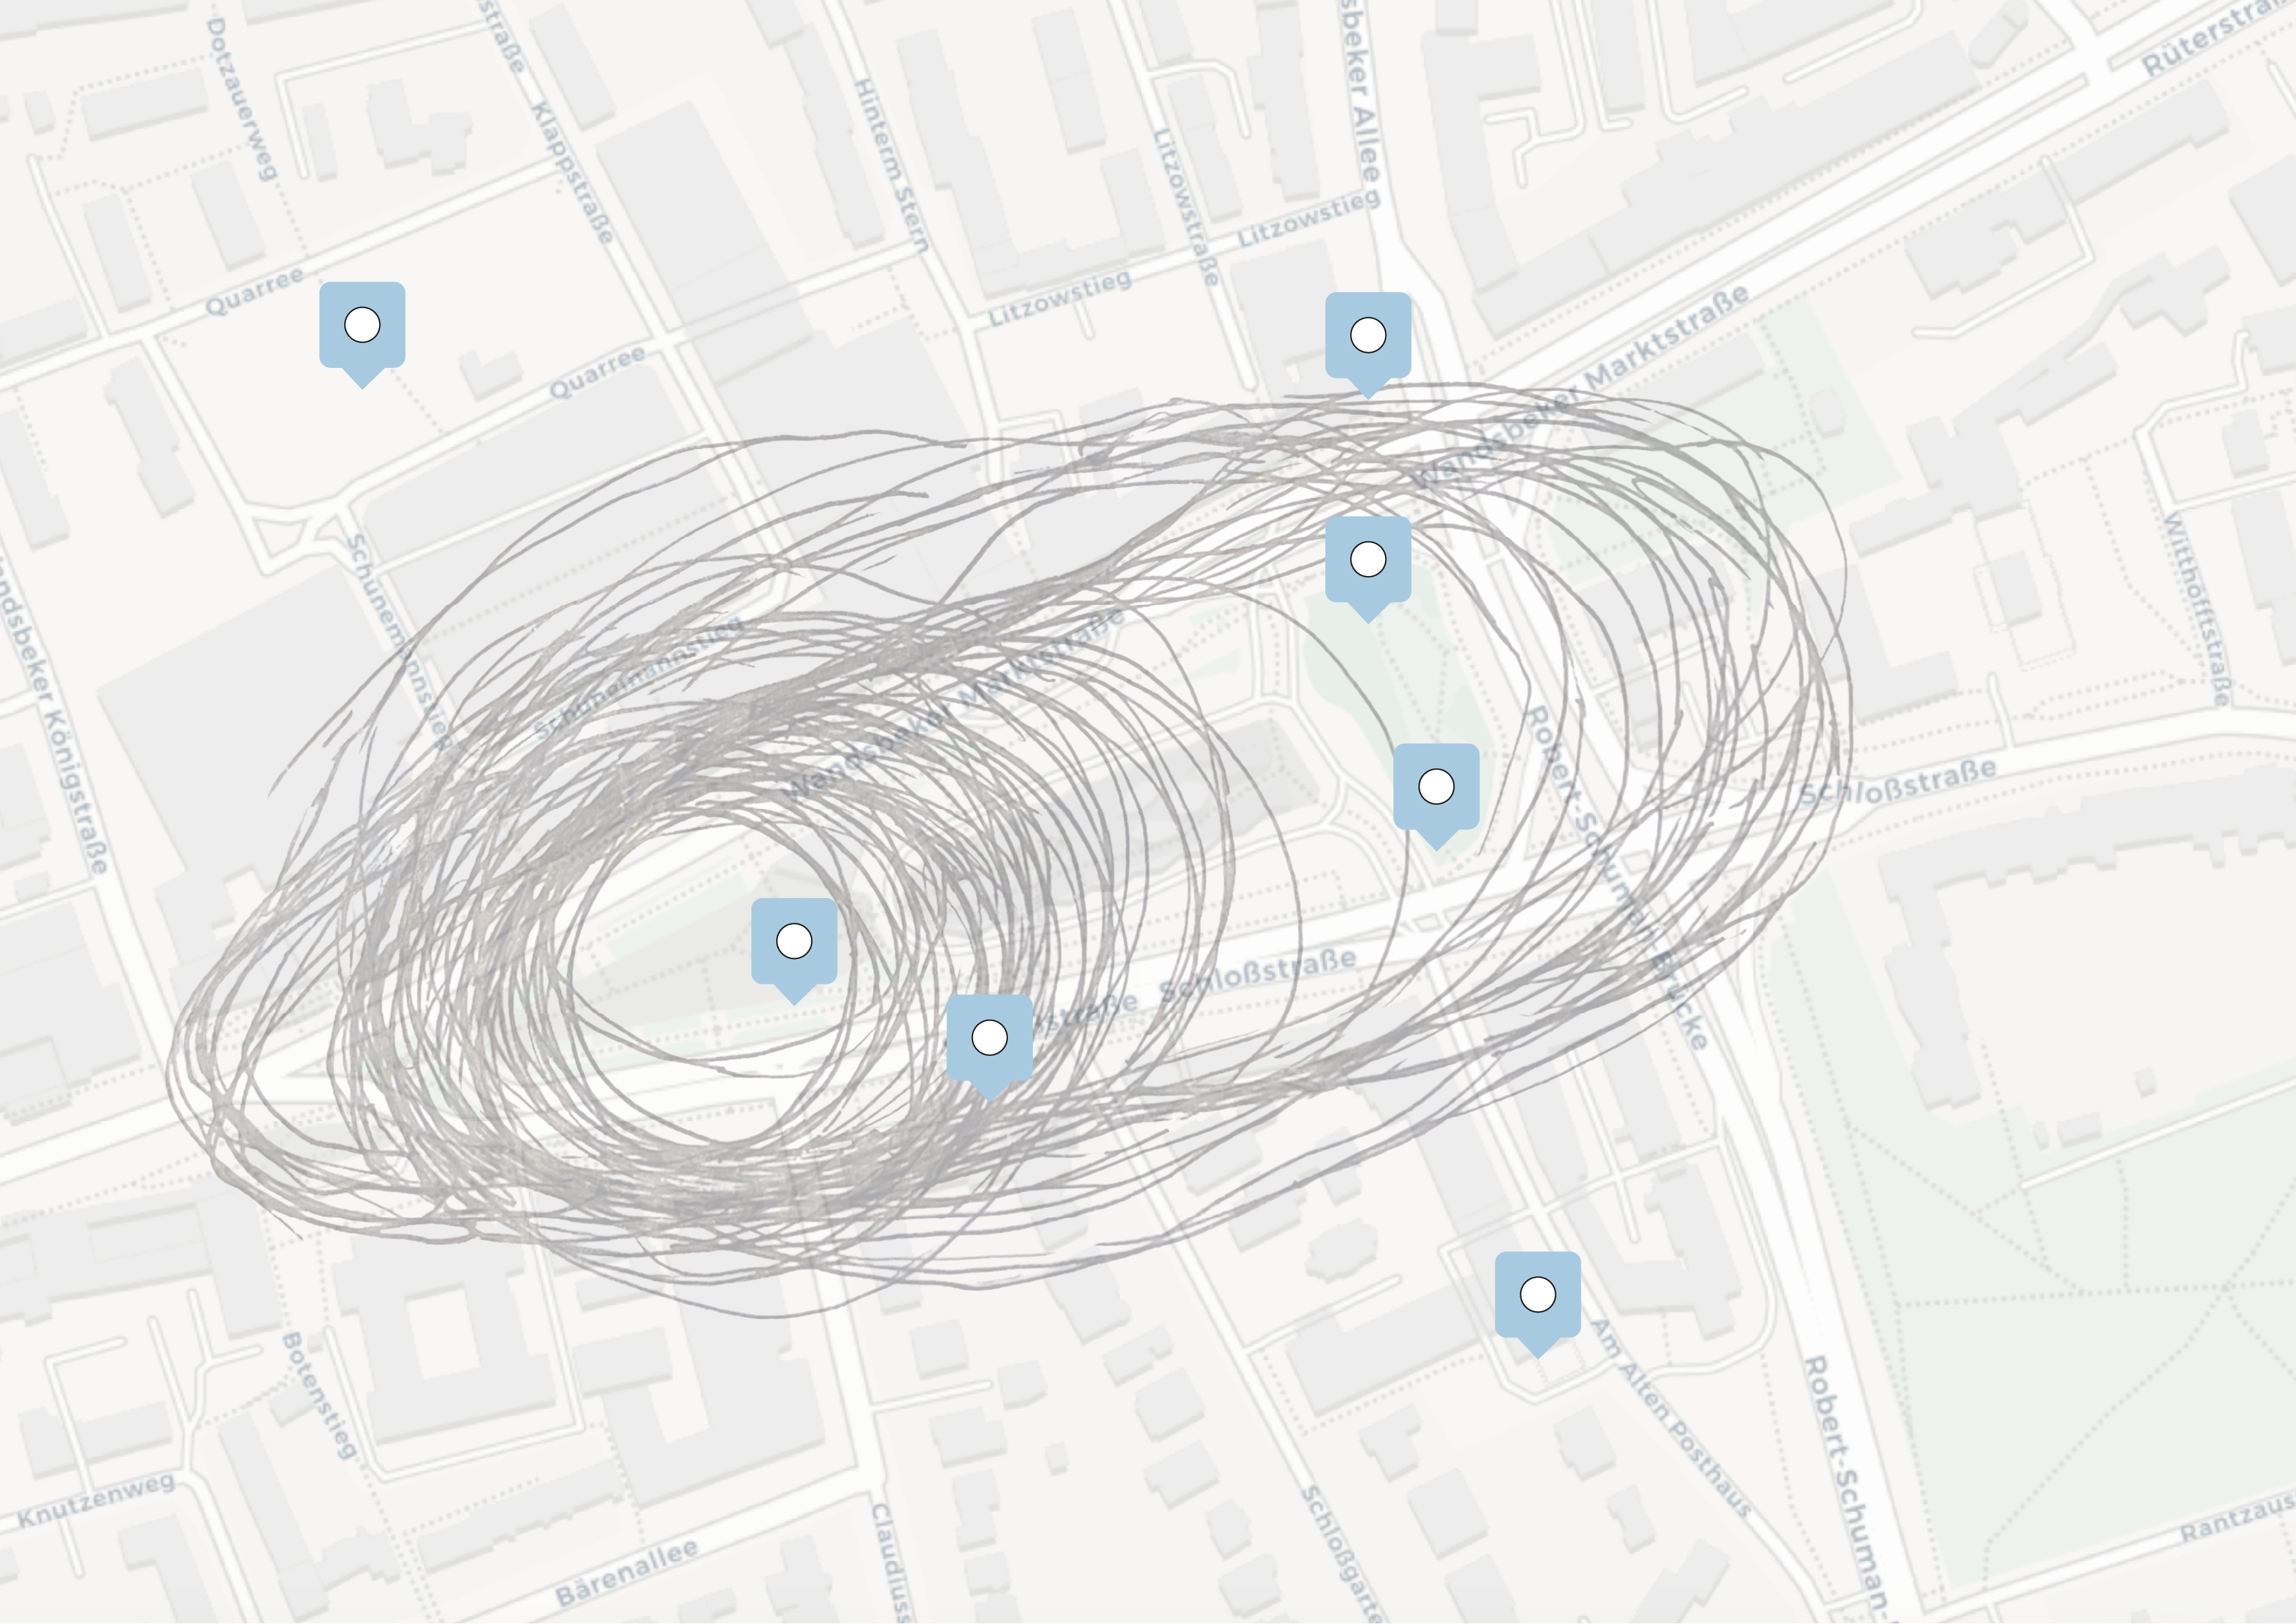
To test the theory and give the proposed interventions a solid basis, traffic noise was recorded at seven measuring points across the area. Following the DIN 45642 standard, a calibrated class 1 sound level meter (PCE-430-EKIT) with a windscreen was placed 7.5 m from the centre of the lane at a height of 1.2 m. Each point was measured in ten-minute intervals and only under permitted weather, so with dry roads and wind below 5 m/s.
Quantitative data collection
Where is it noisy? Who creates noise?
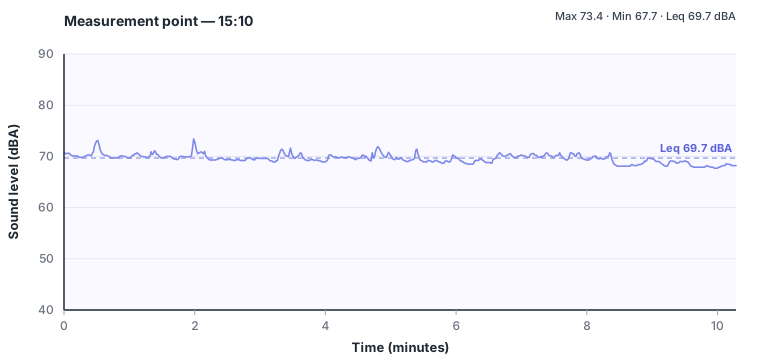
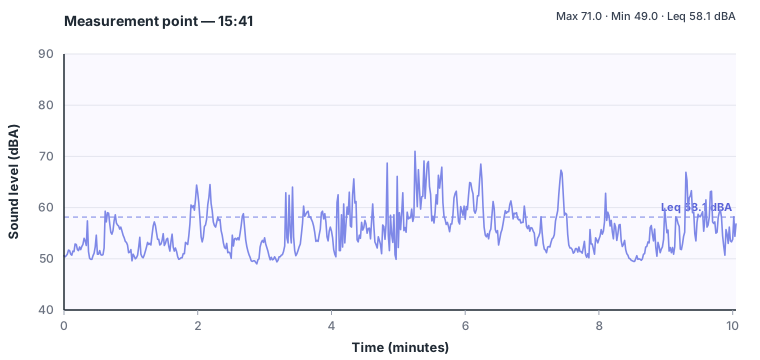
Interactive map (dBA):
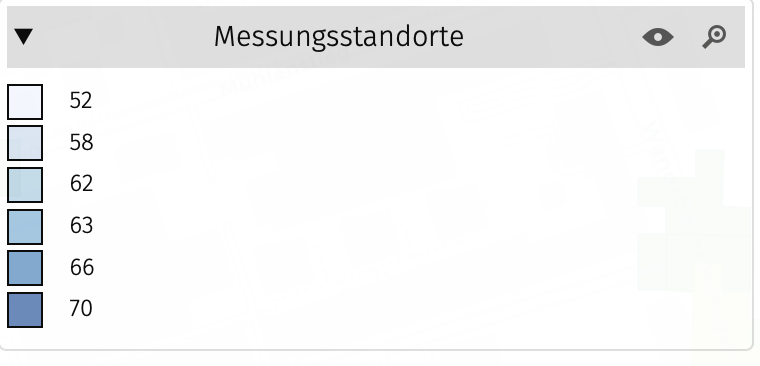
The interactive map below shows how loud the situation at each measuring point actually was. The mapping tool was introduced in the workshop and makes it easy to turn raw readings into explorable data maps.
Qualitative data collection
Questionnaires: subjective sound perception
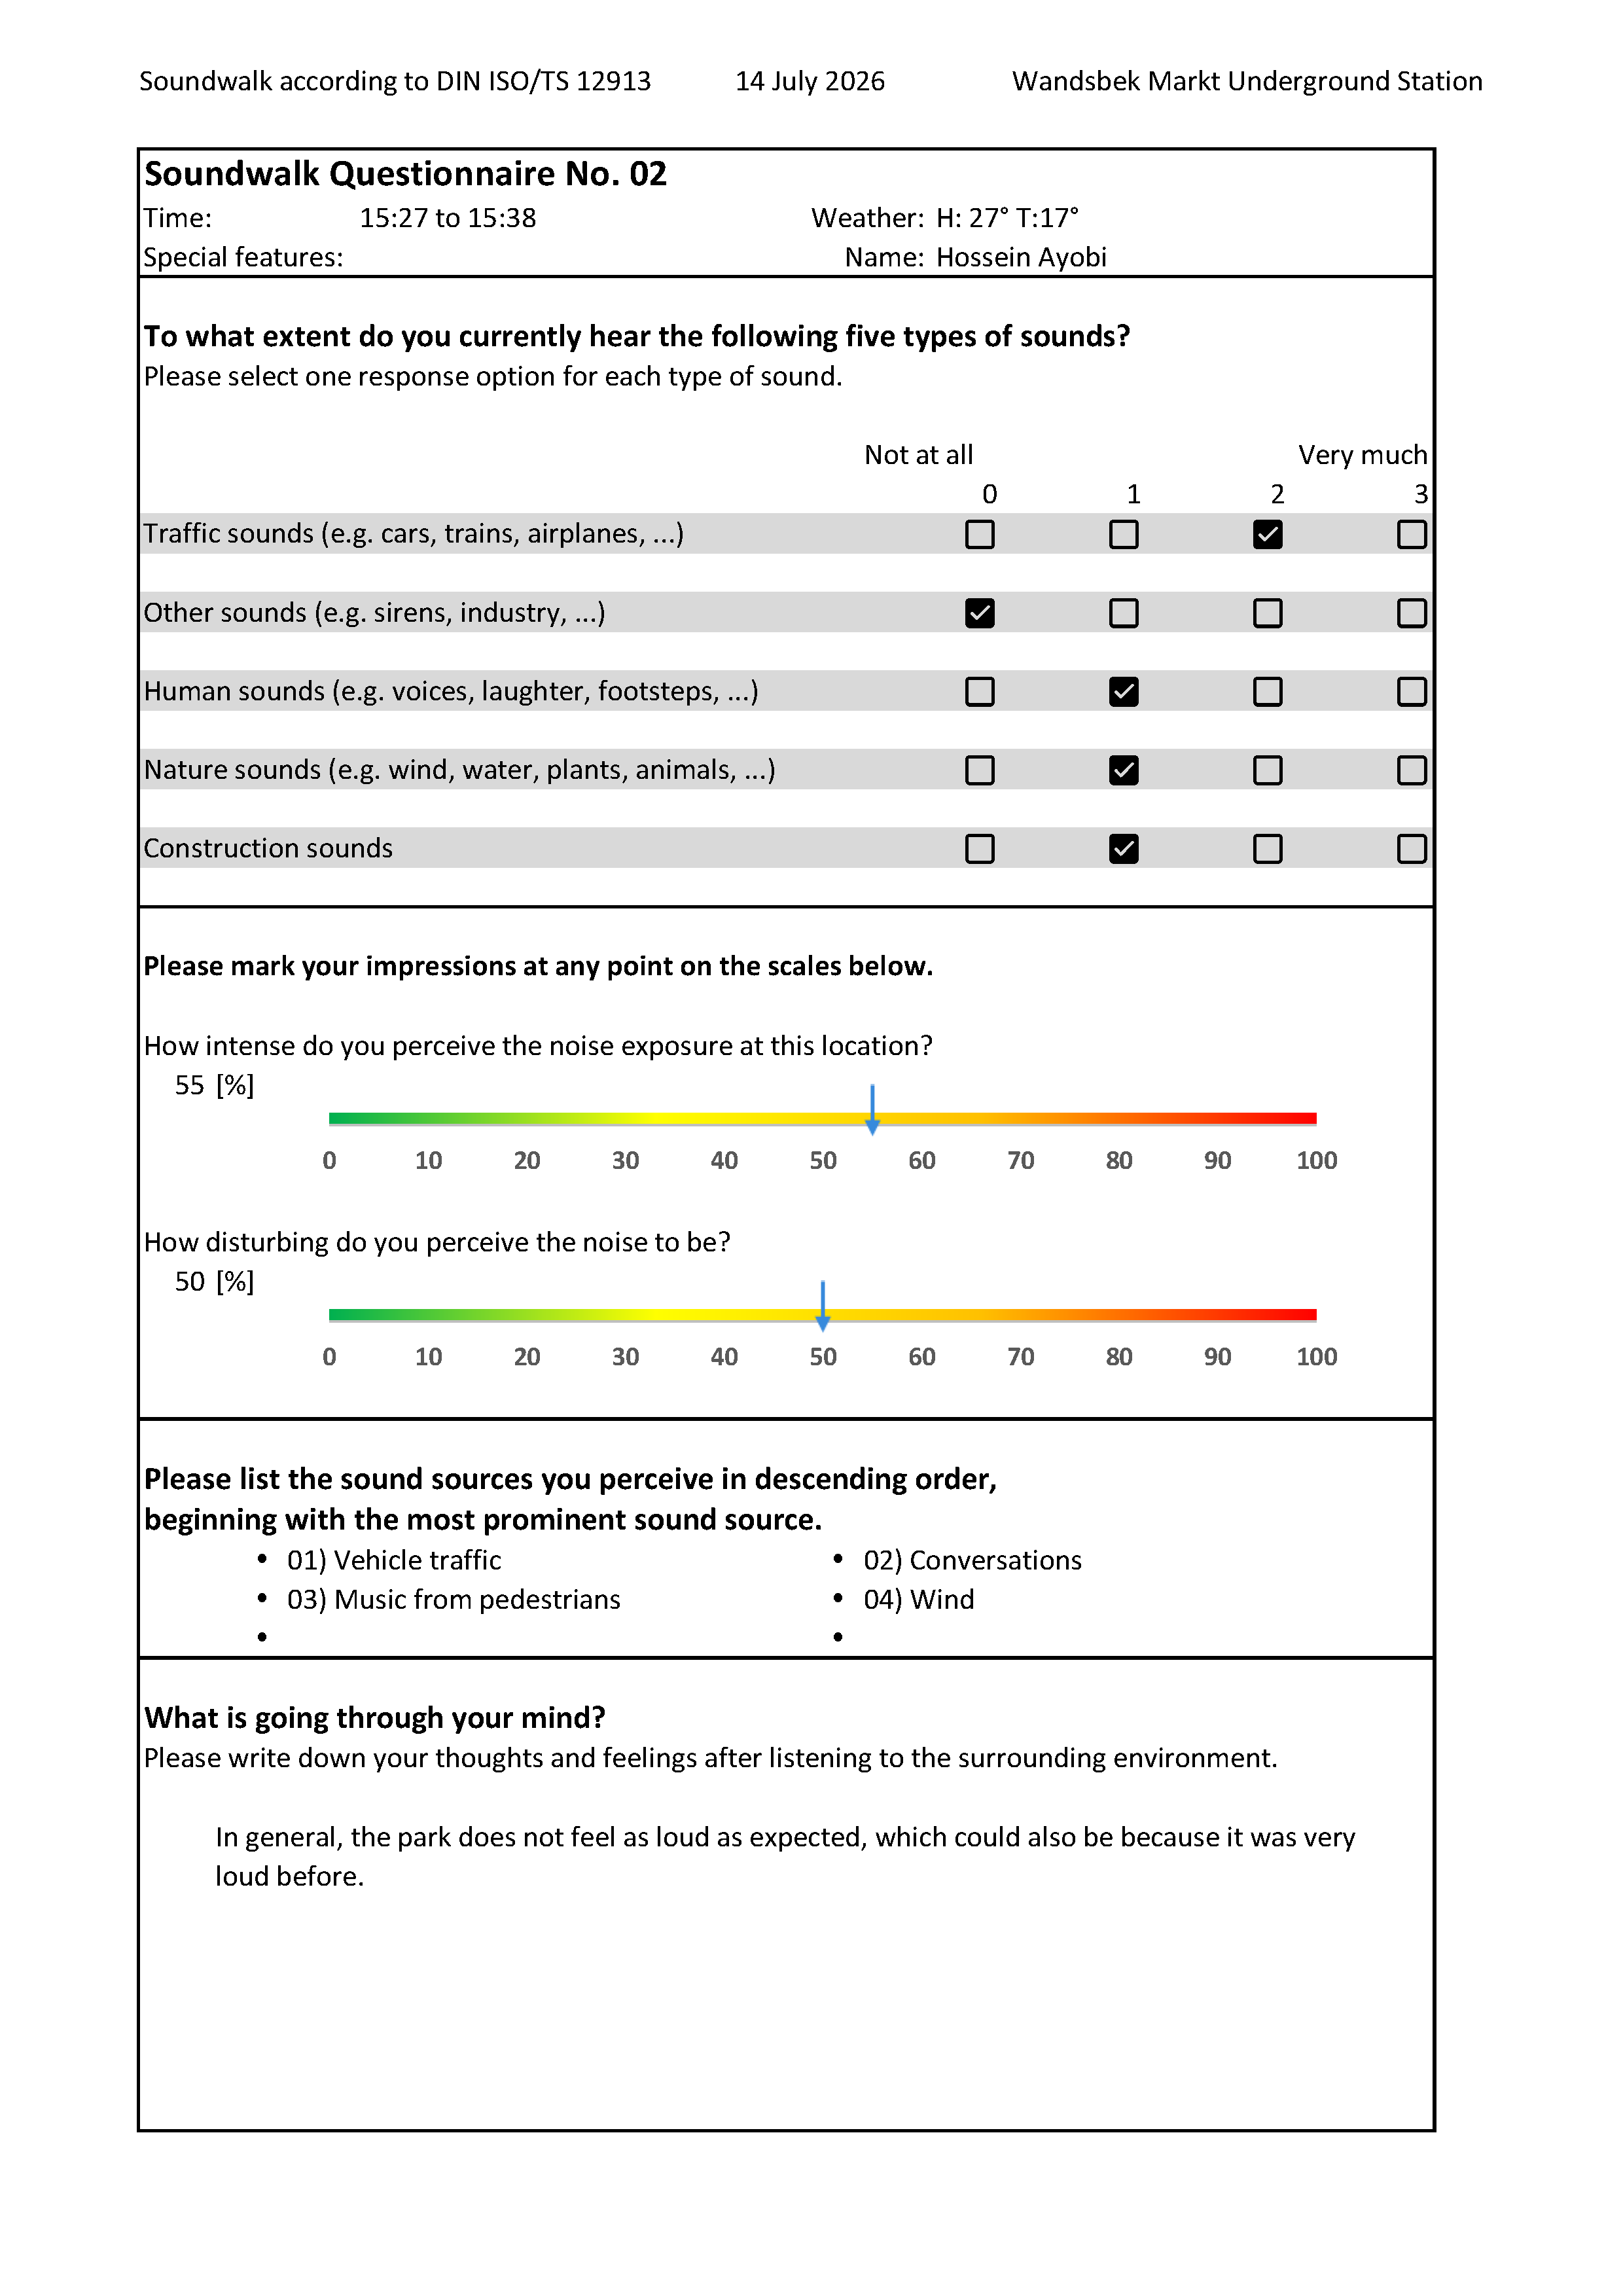
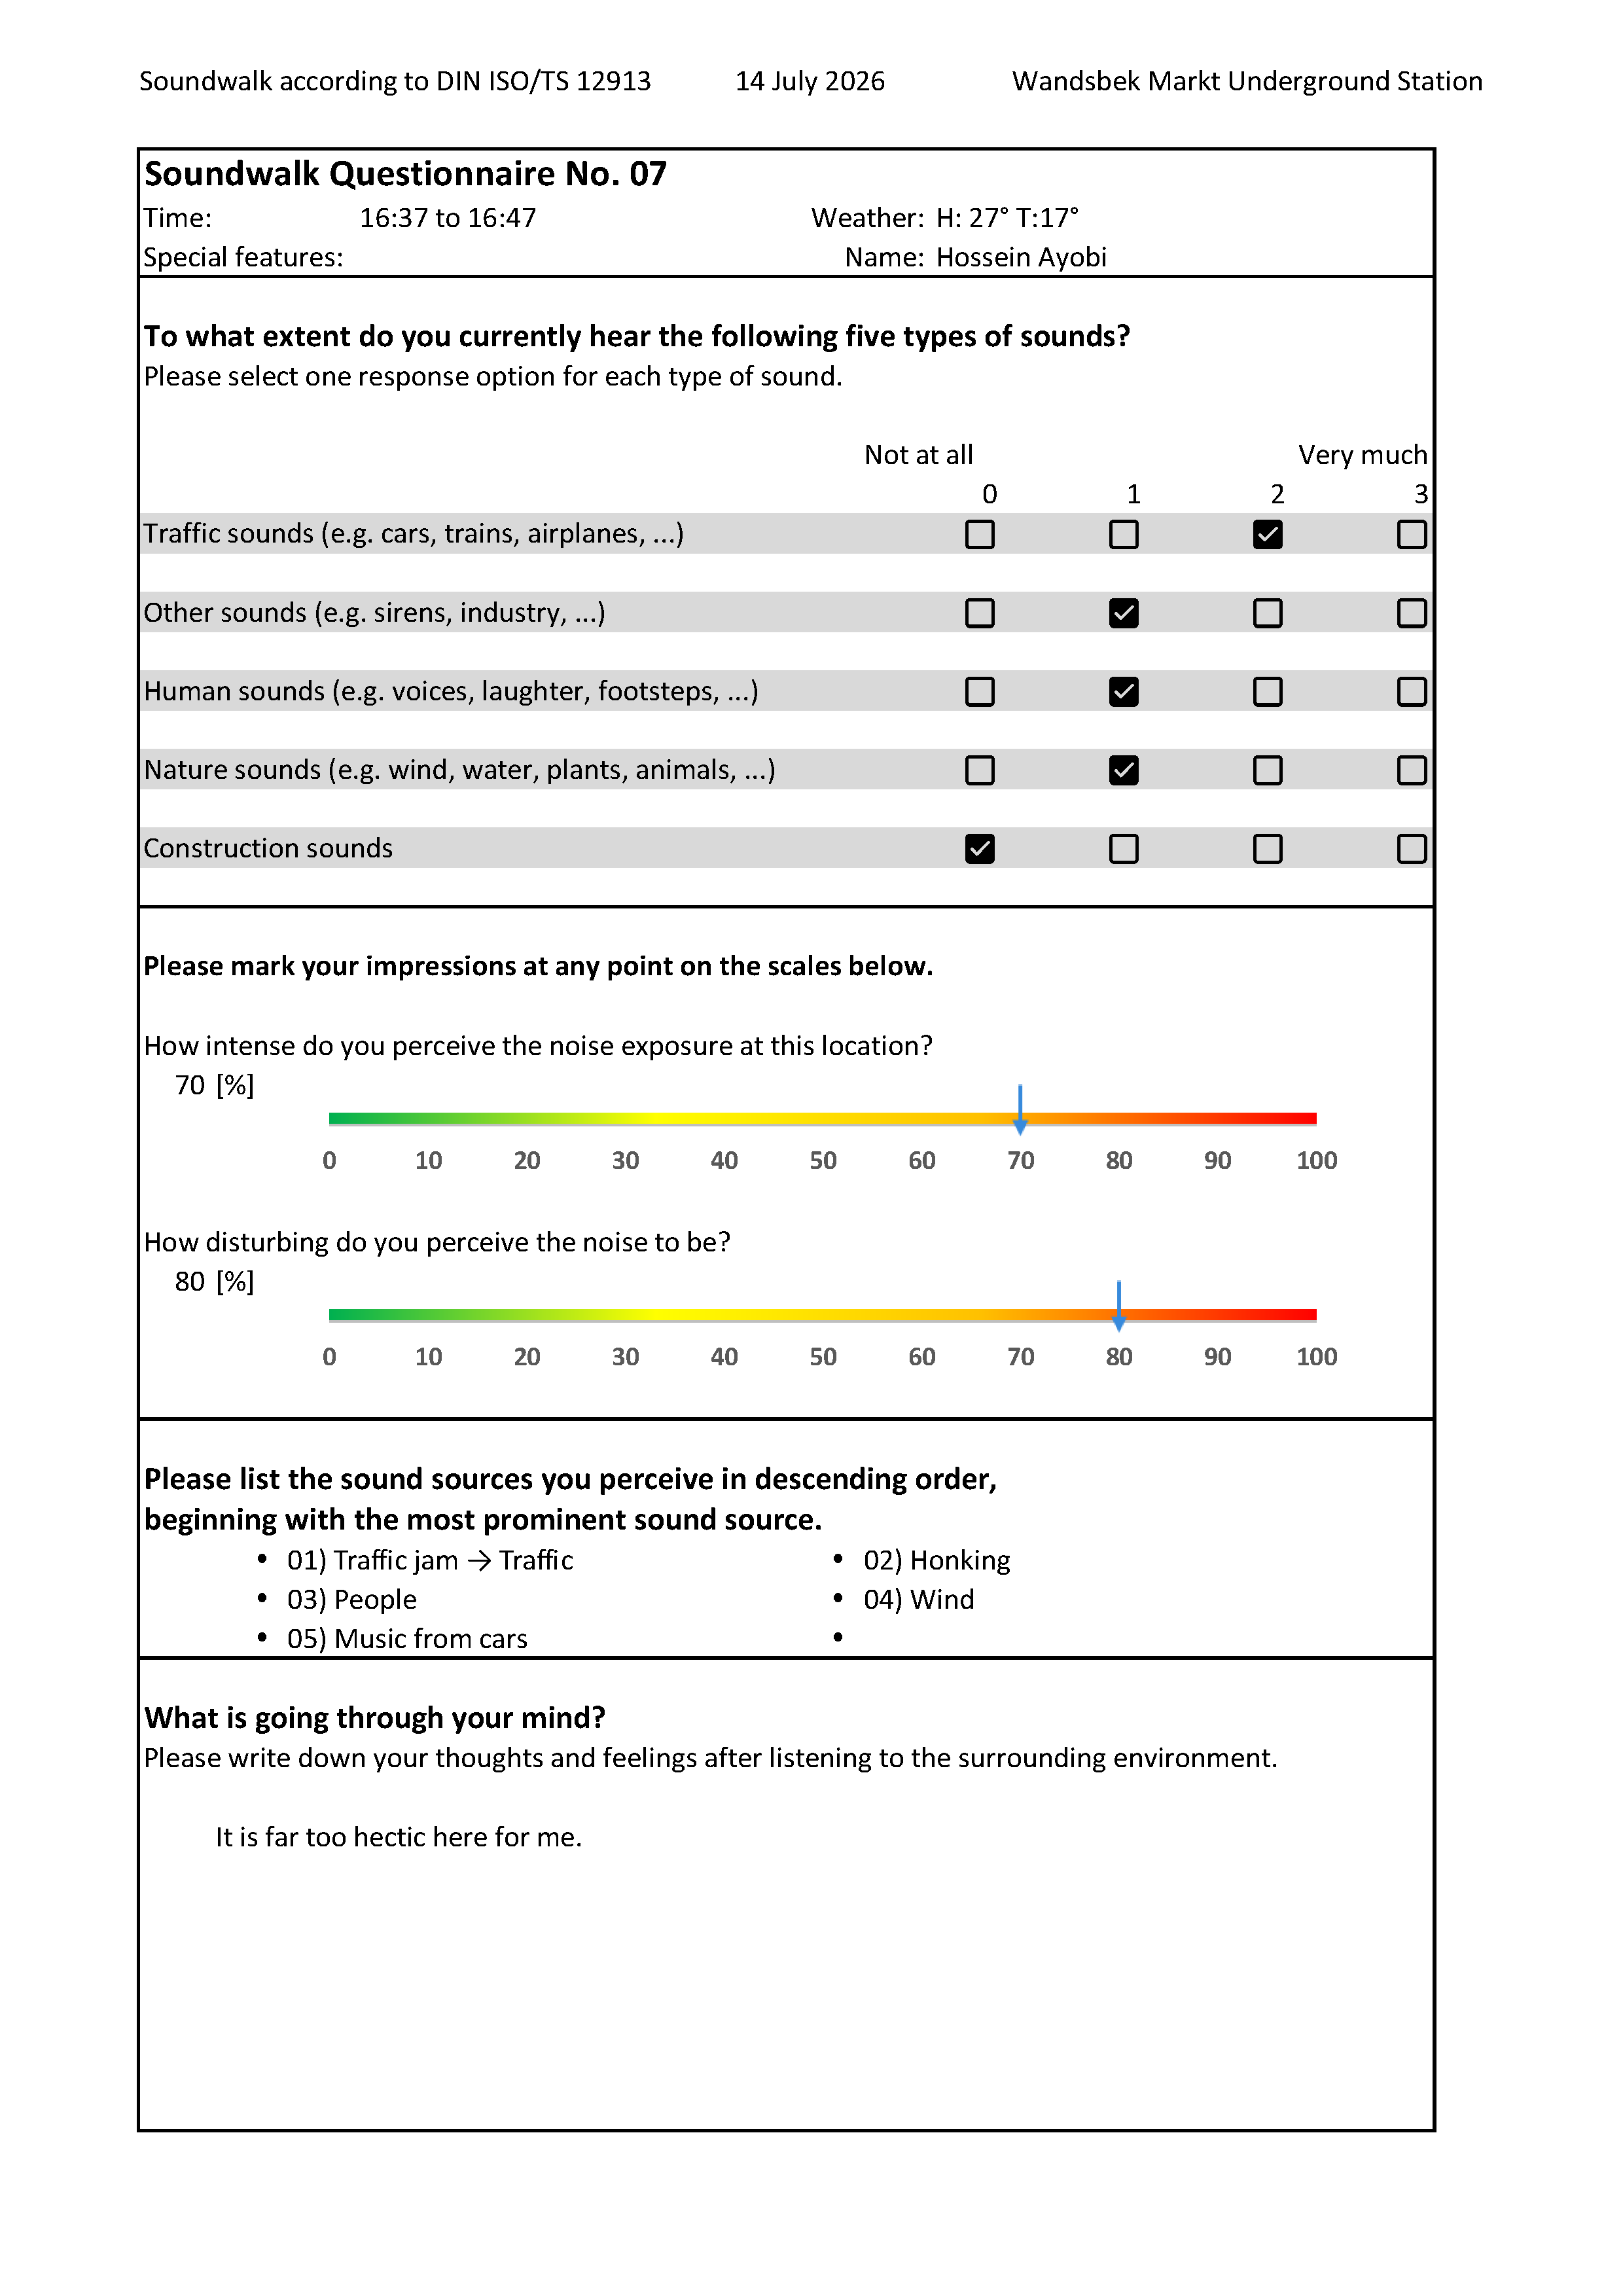
Sound is subjective. The same street can feel calm to one person and overwhelming to another, depending on what they are doing and what they expect to hear. Attention, mood and personal sensitivity all shape how loud a place actually feels, which is why perceived noise and measured noise do not always line up. To capture that, we used questionnaires (according to DIN ISO 12013) to explore the different qualities and perceptions of sound.
What are you hearing?
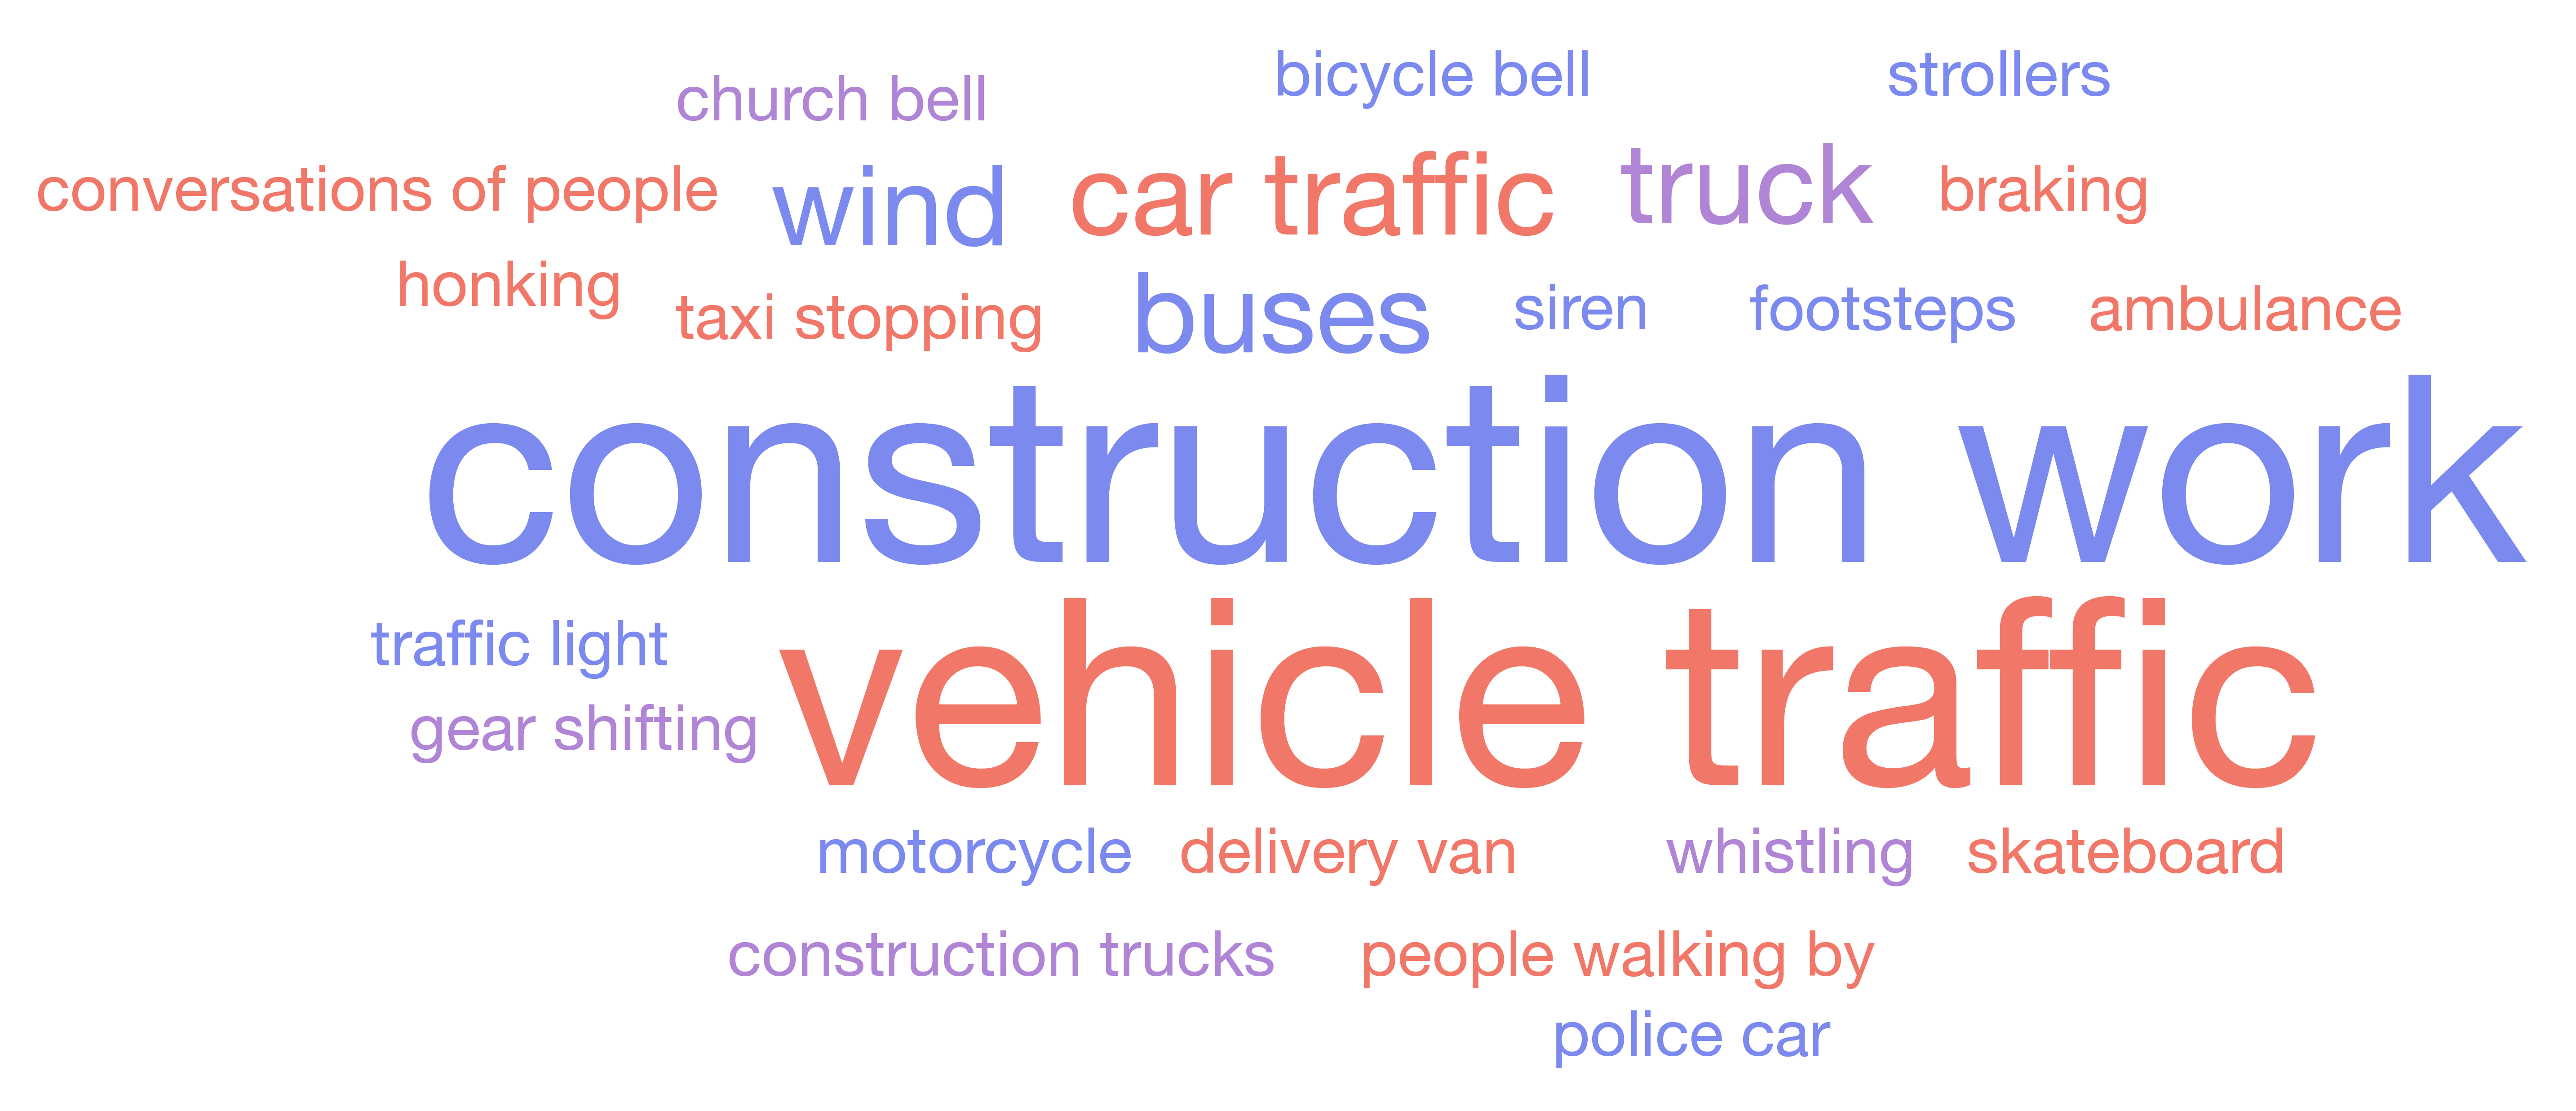
FYI. Not everyone notices the same sounds. When you are focused on a task, other layers of noise can slip past you, while someone standing next to you hears them loud and clear. Below are some of the sounds that we picked up during our site visit.
Existing data (GeoPortal Hamburg):
Does the existing Data support our finding? Yes!
The city of Hamburg also publishes noise data through its geoportal. On the maps you can see their data laid over ours, which creates a similar but more precise picture. Together they give a more differentiated view of Wandsbek Markt that can be used to pinpoint where the interventions should go.
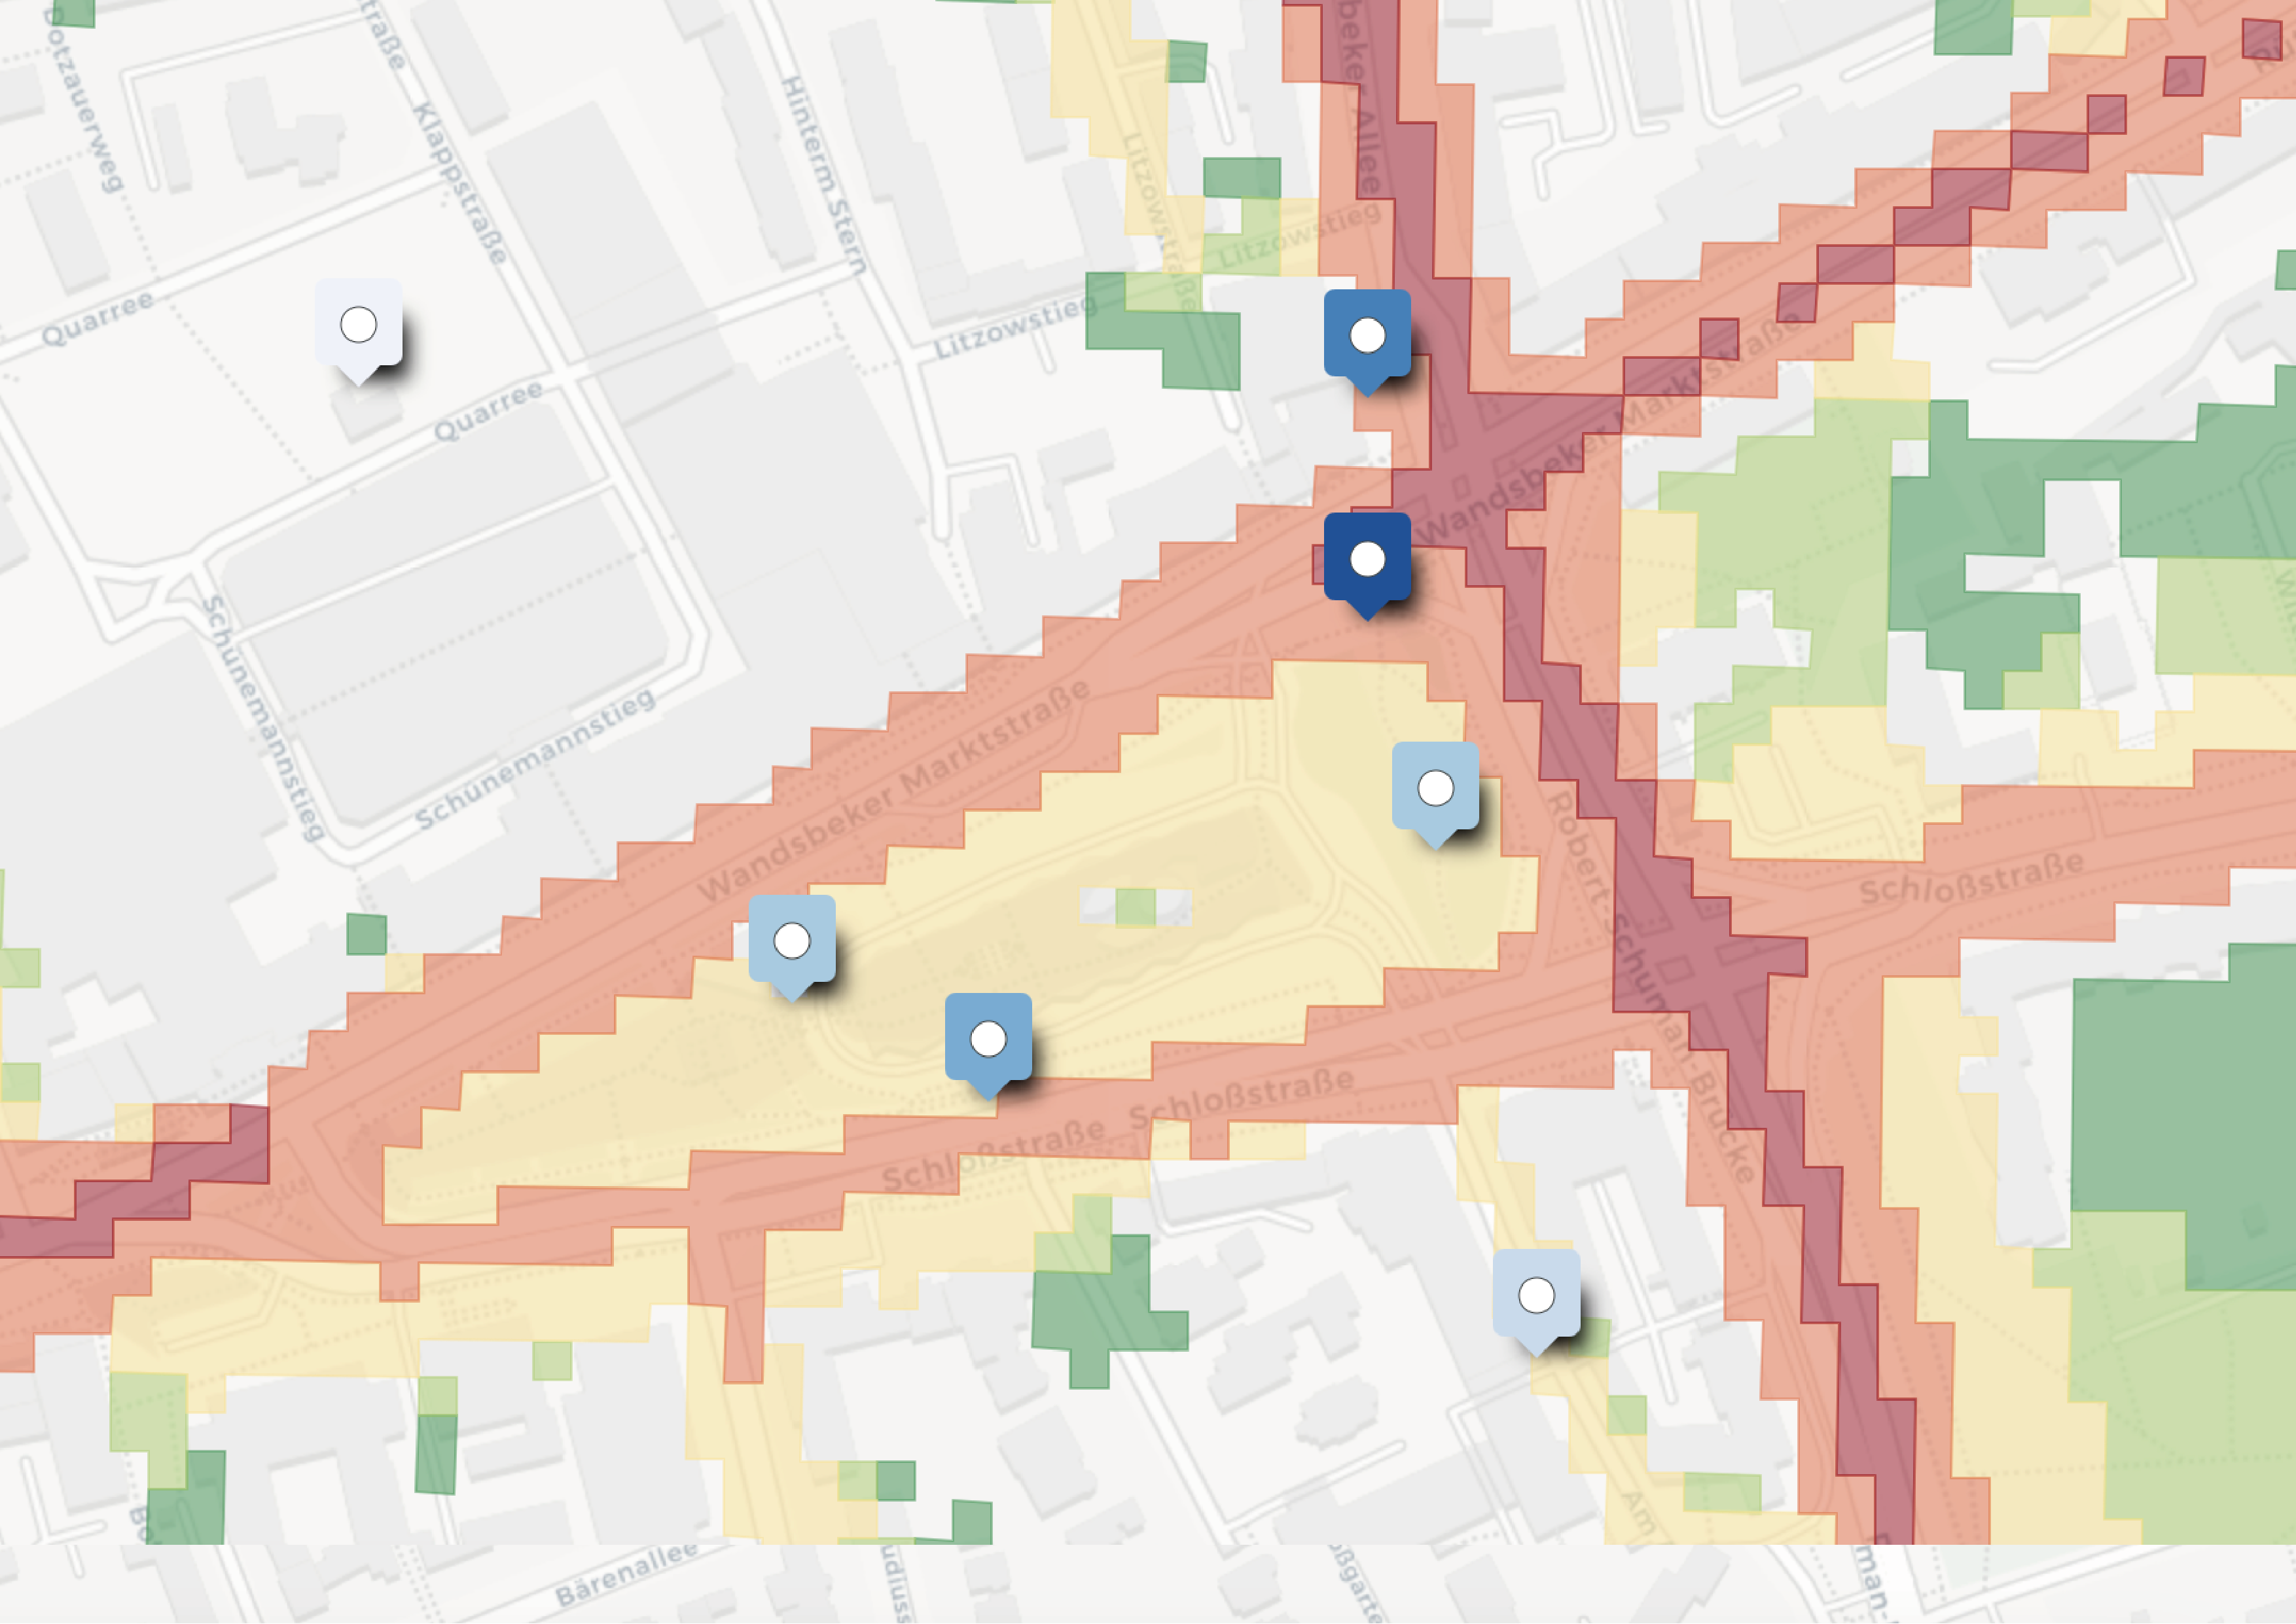
Combined result:
Differentiated storms, targeted interventions
Back to the opening image. Instead of one big storm, a more differentiated picture shows in which several smaller storms become visible. Each eye of the storm then becomes the point for one of our suggested targeted interventions.
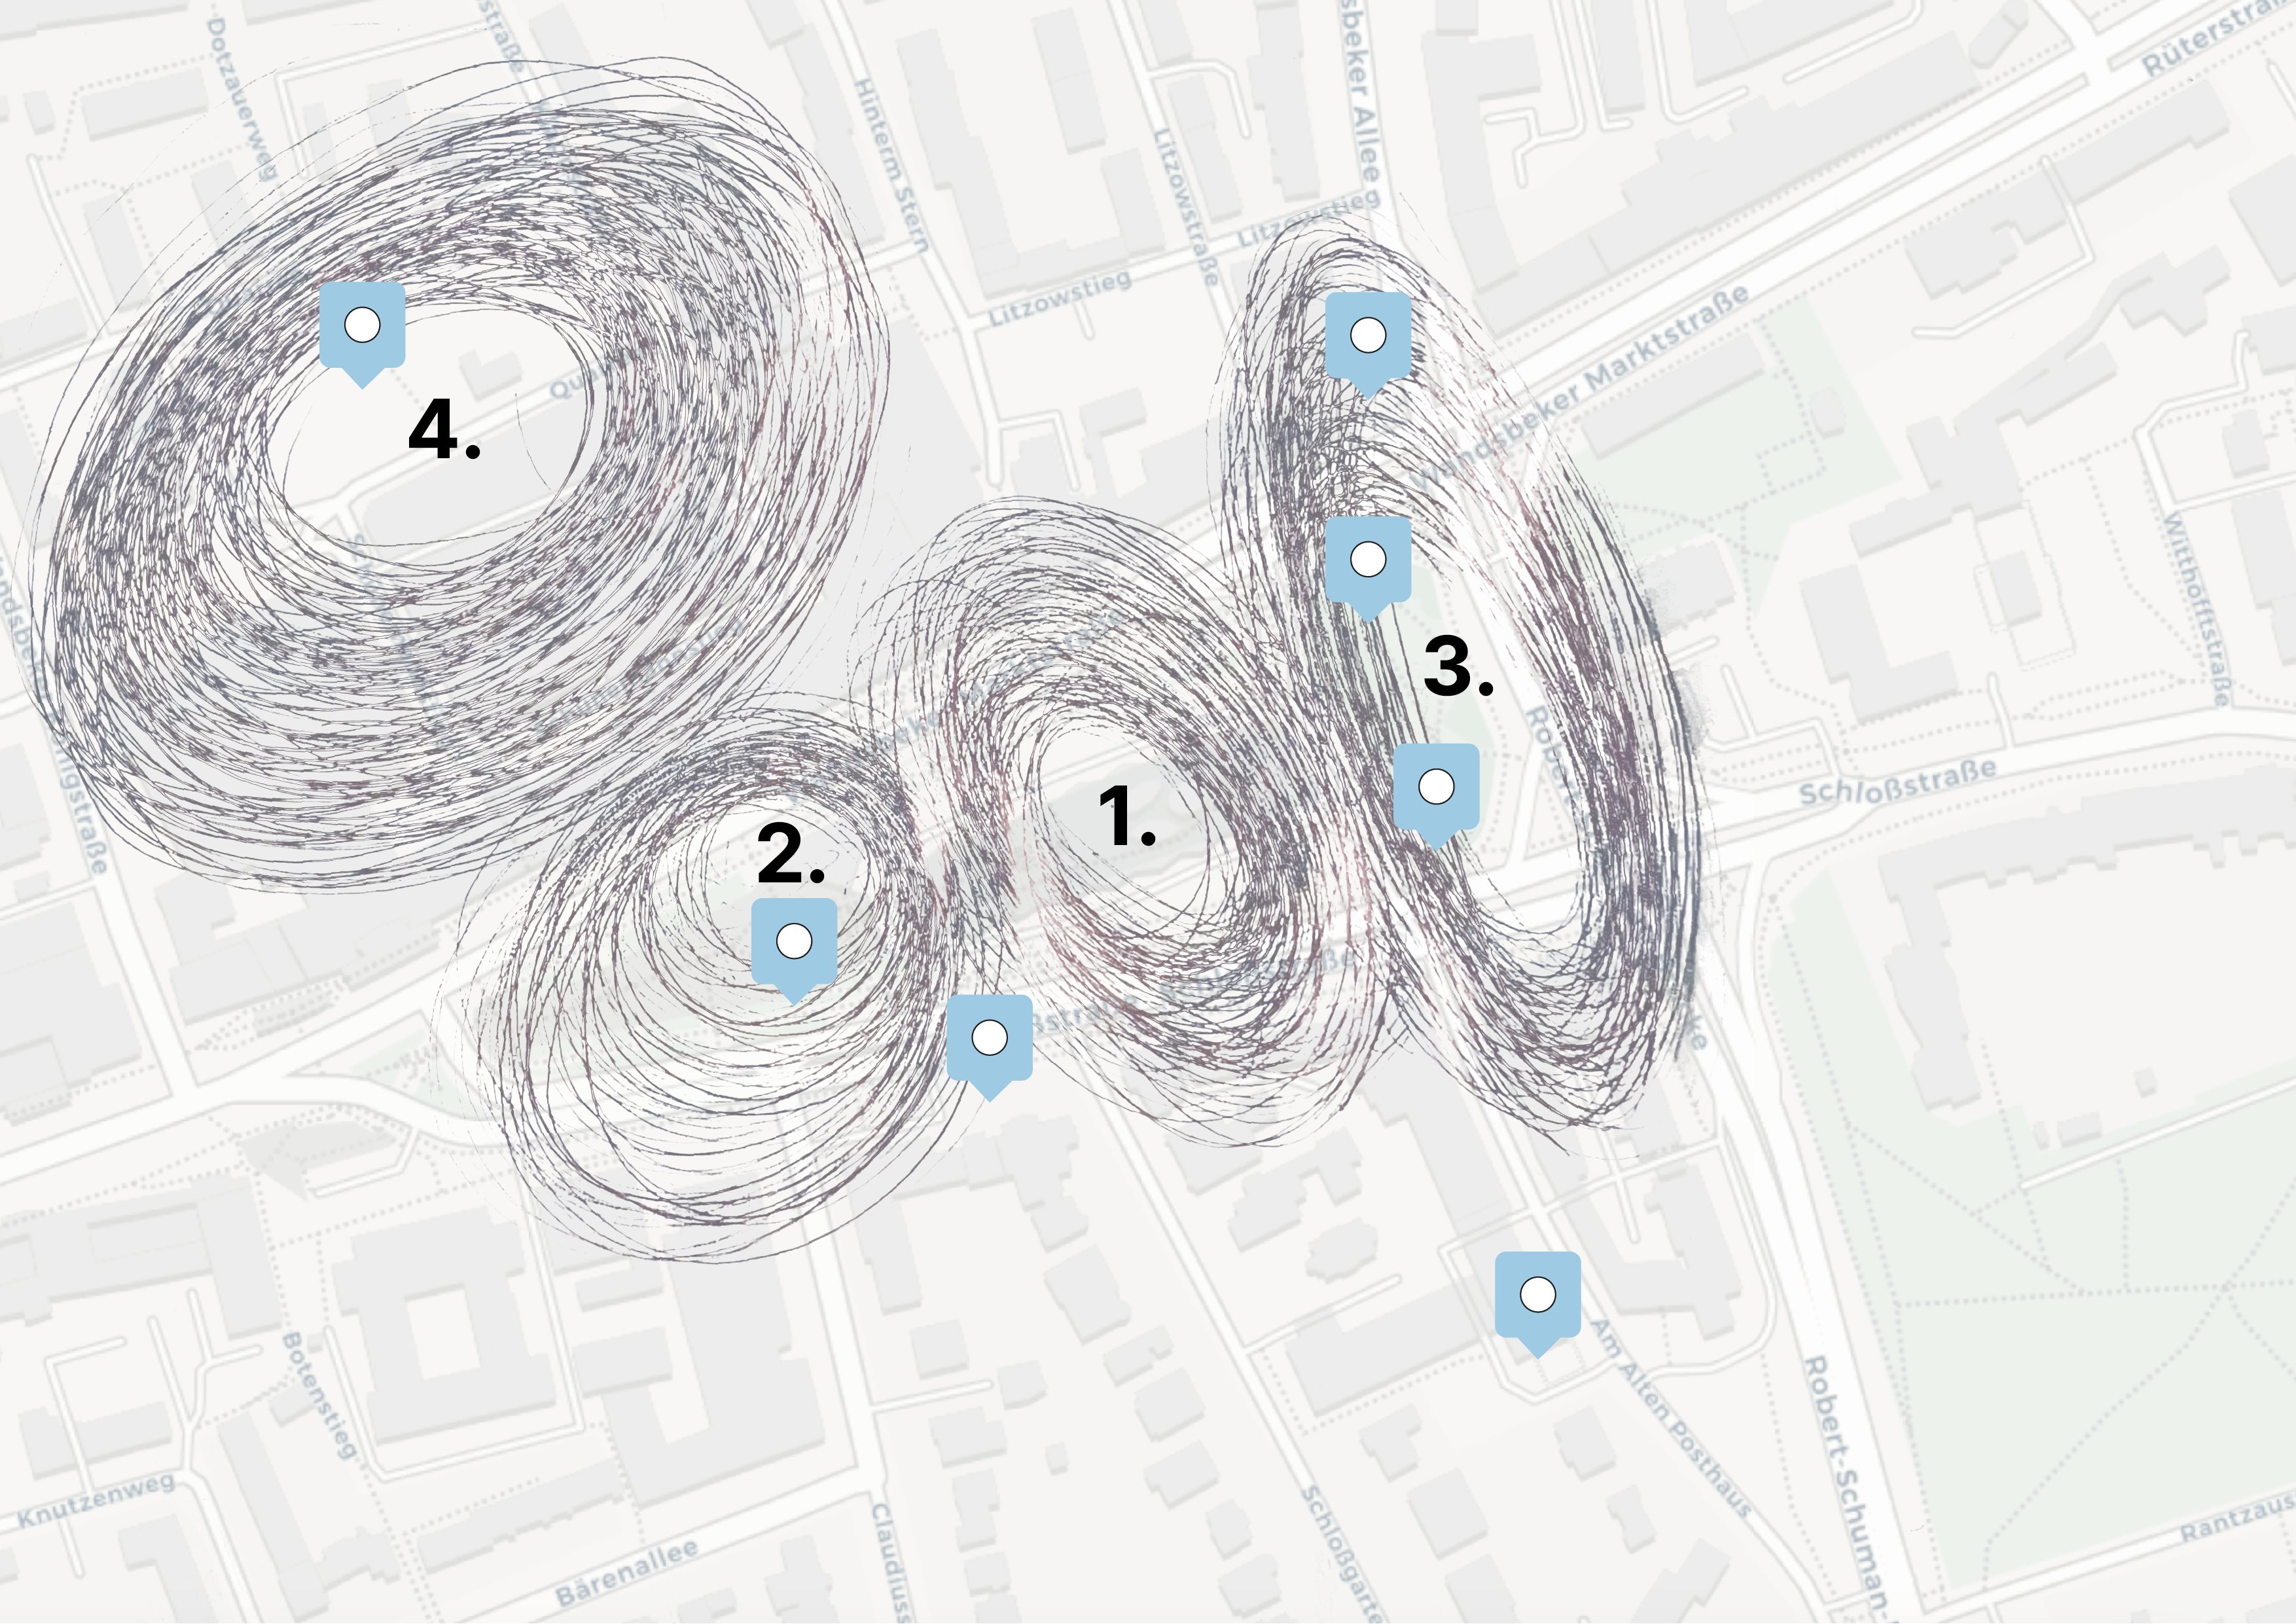
1.
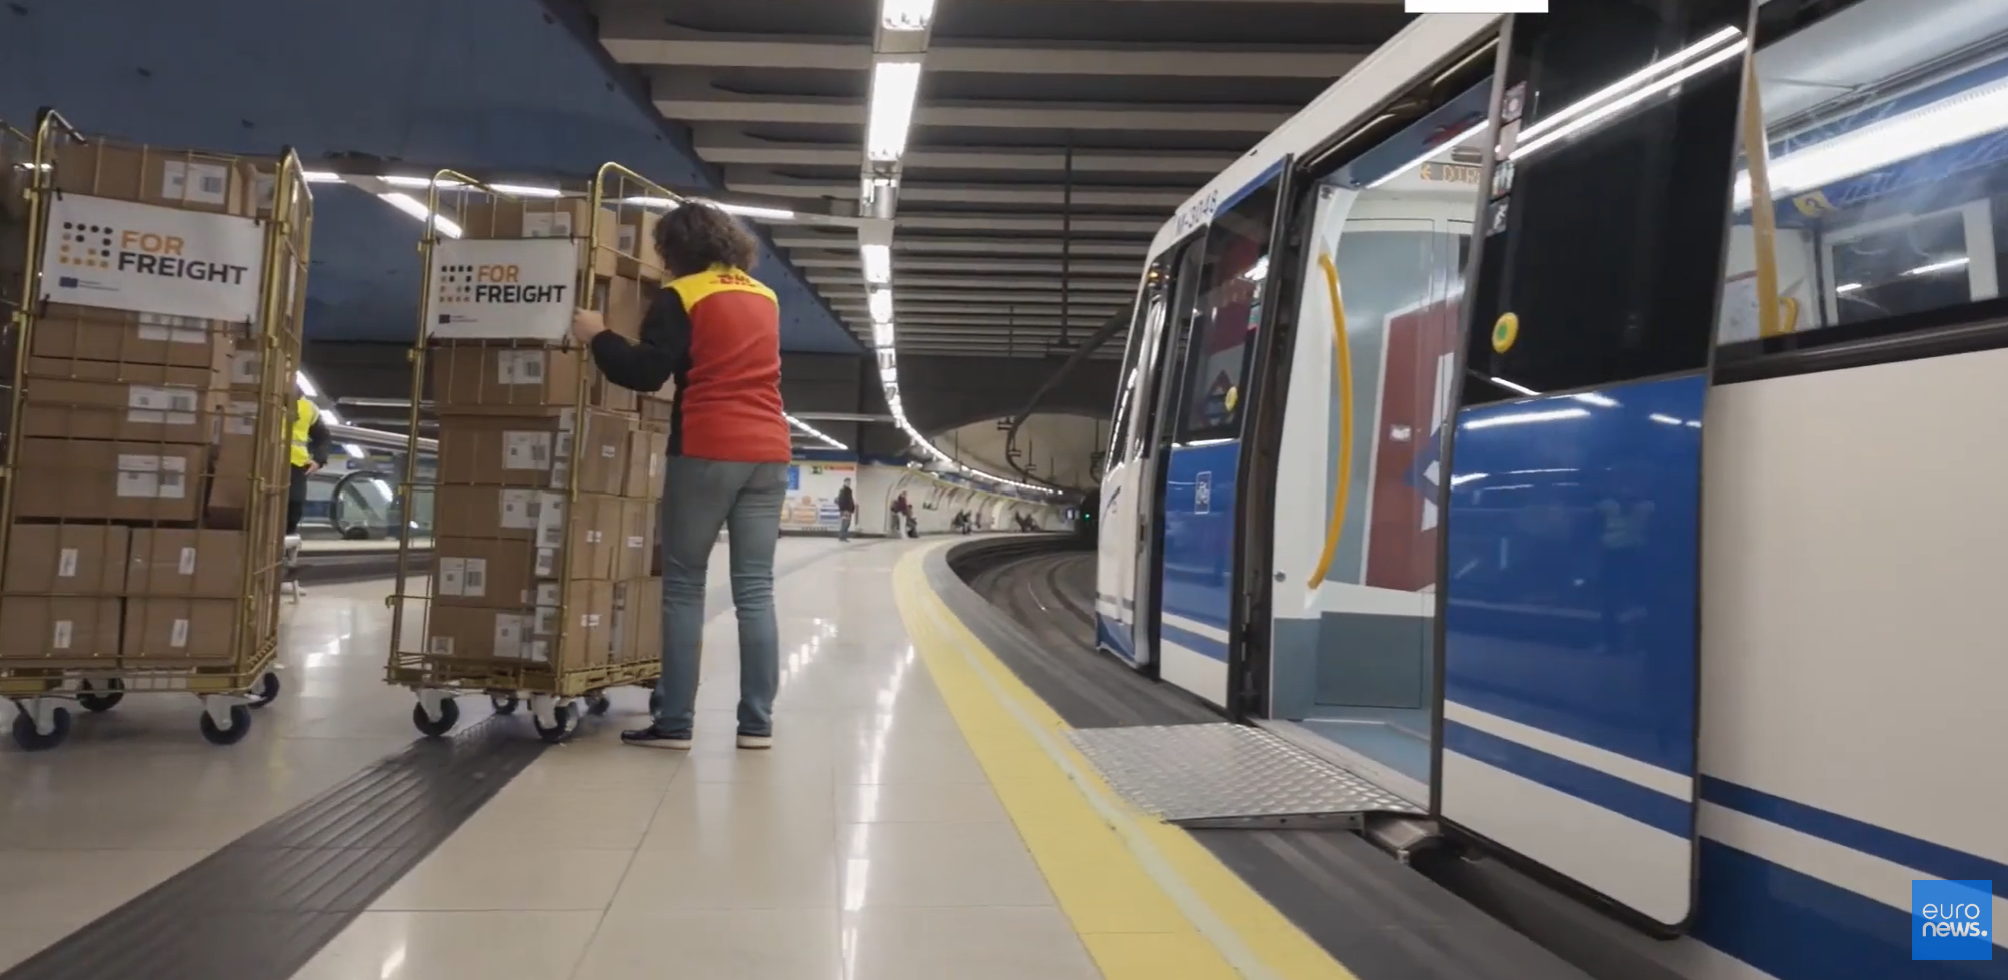
Metro parcel delivery service
The idea is to move parcel deliveries onto the metro instead of vans and trucks outside of rush hours. Fewer delivery vehicles on the street means less traffic at Wandsbek Markt, which directly lowers the noise at ground level. It also frees up space that is otherwise blocked by parking trucls
2.
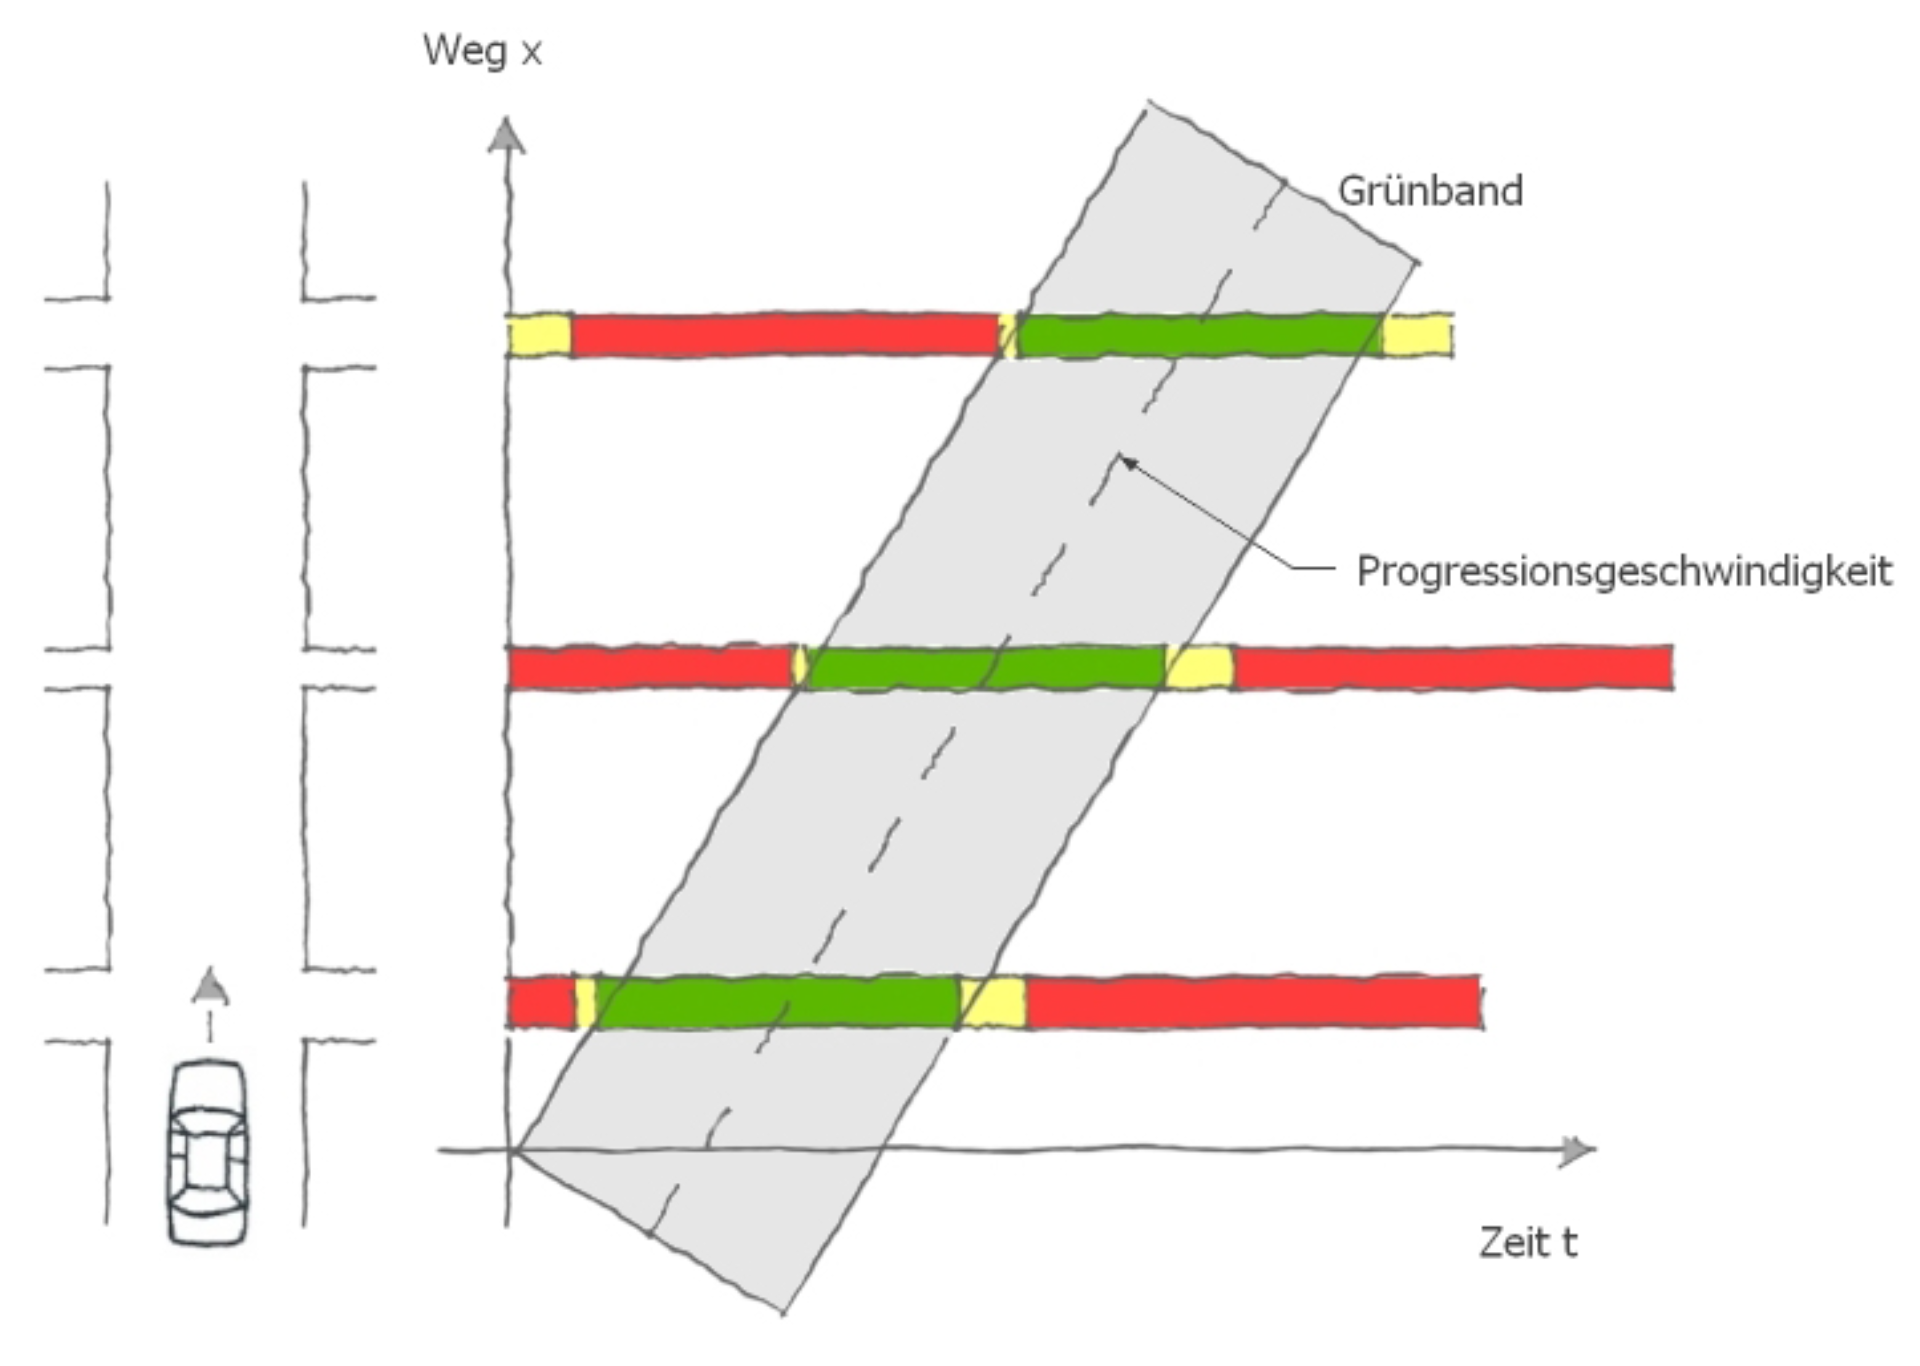
30 km/h zone and "Grüne Welle"
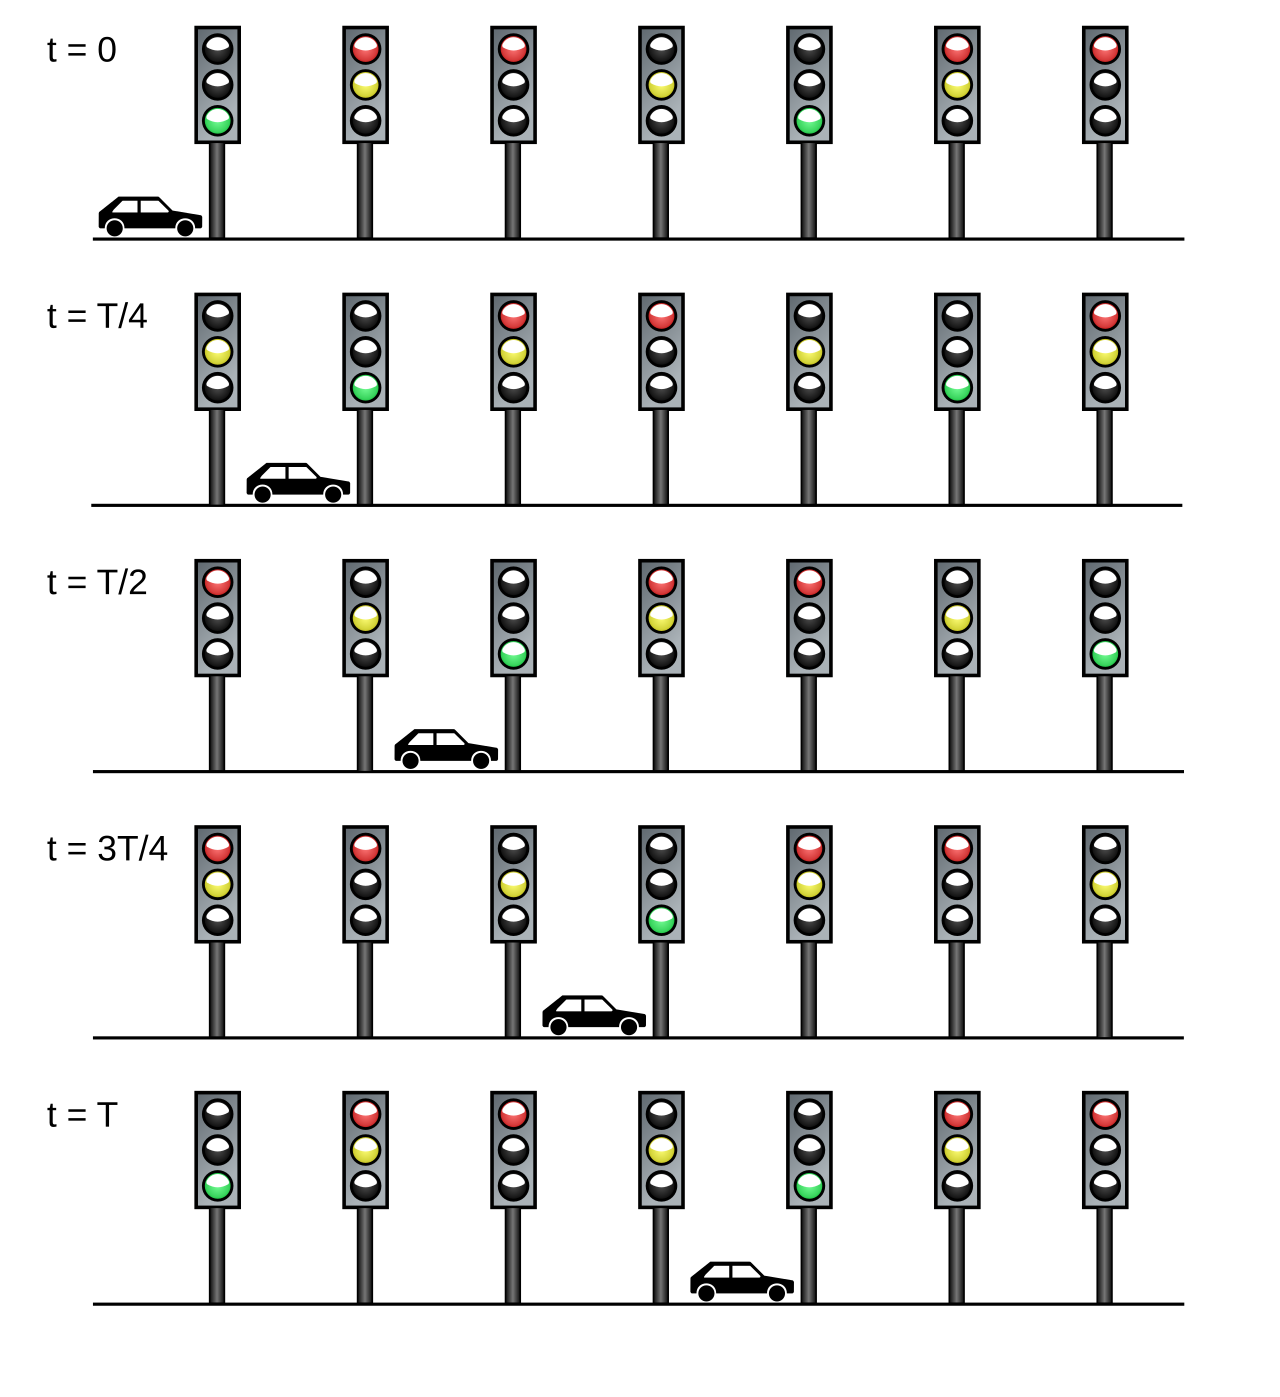
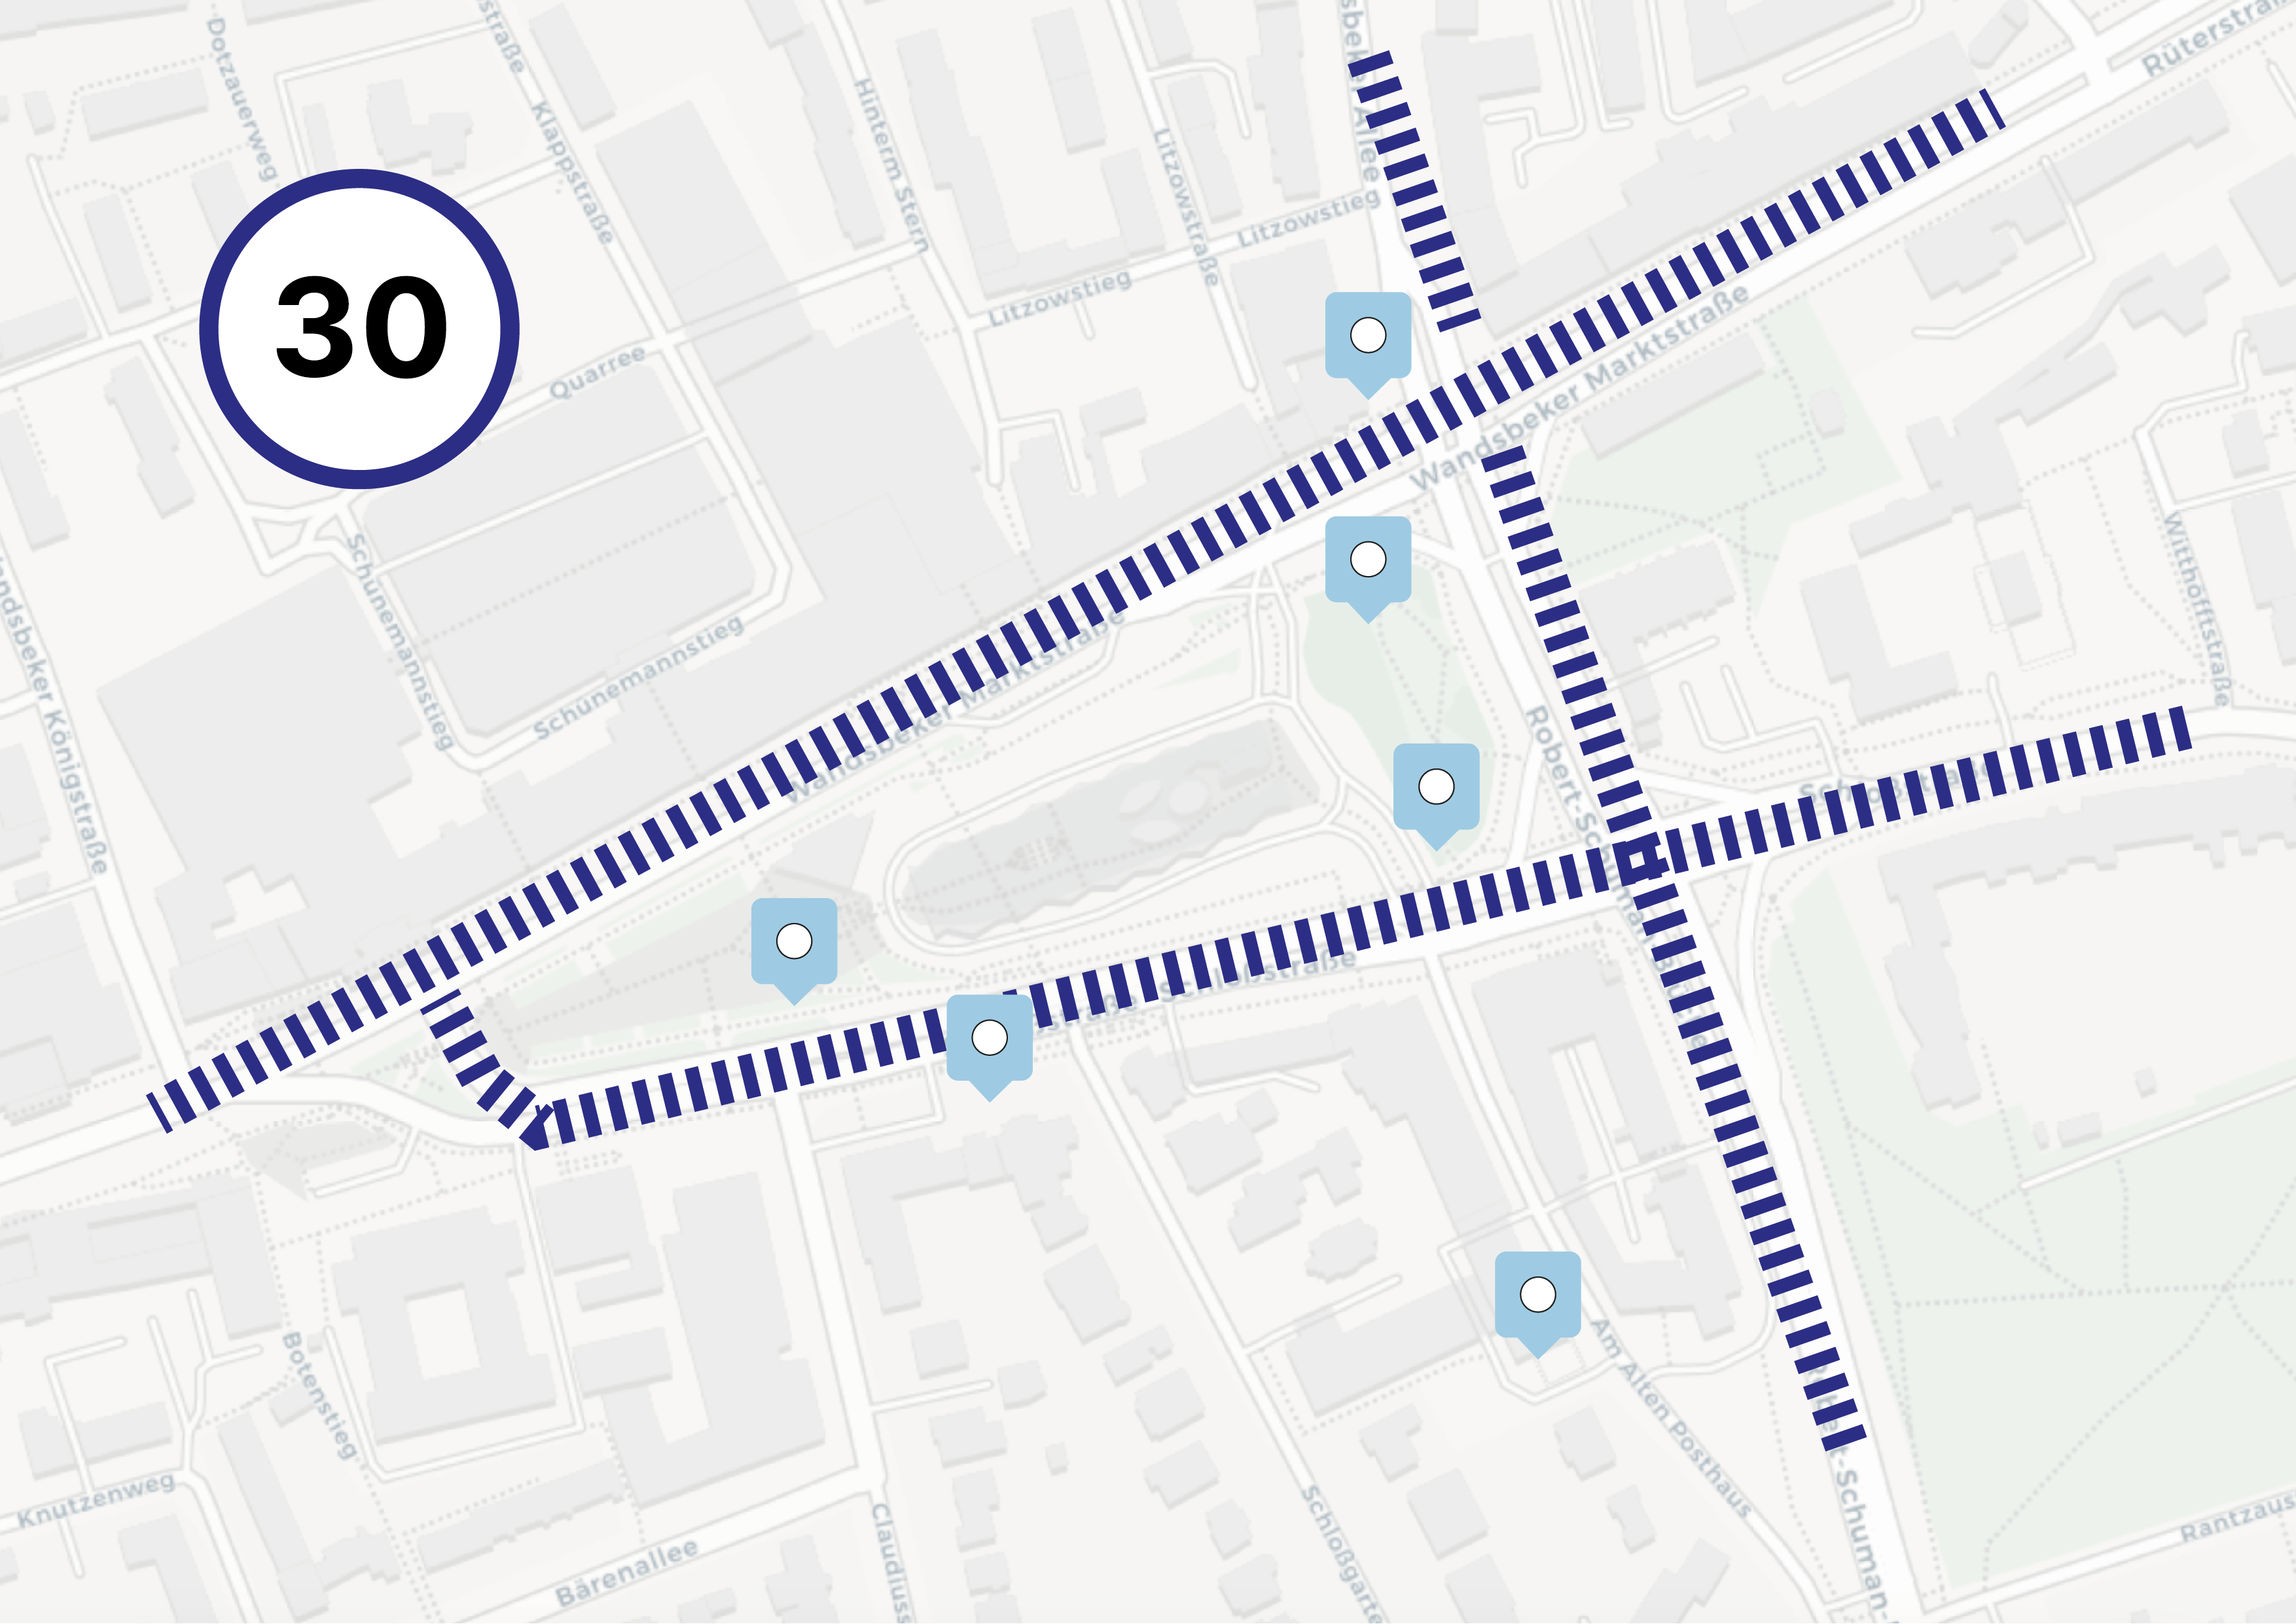
Lowering the limit to 30 km/h and timing the traffic lights into a green wave keeps cars moving at a steady, slower pace. Less braking and accelerating means quieter engines and less tyre noise. Traffic keeps flowing, but the whole street feels calmer.
3.
Noise reduction through greening
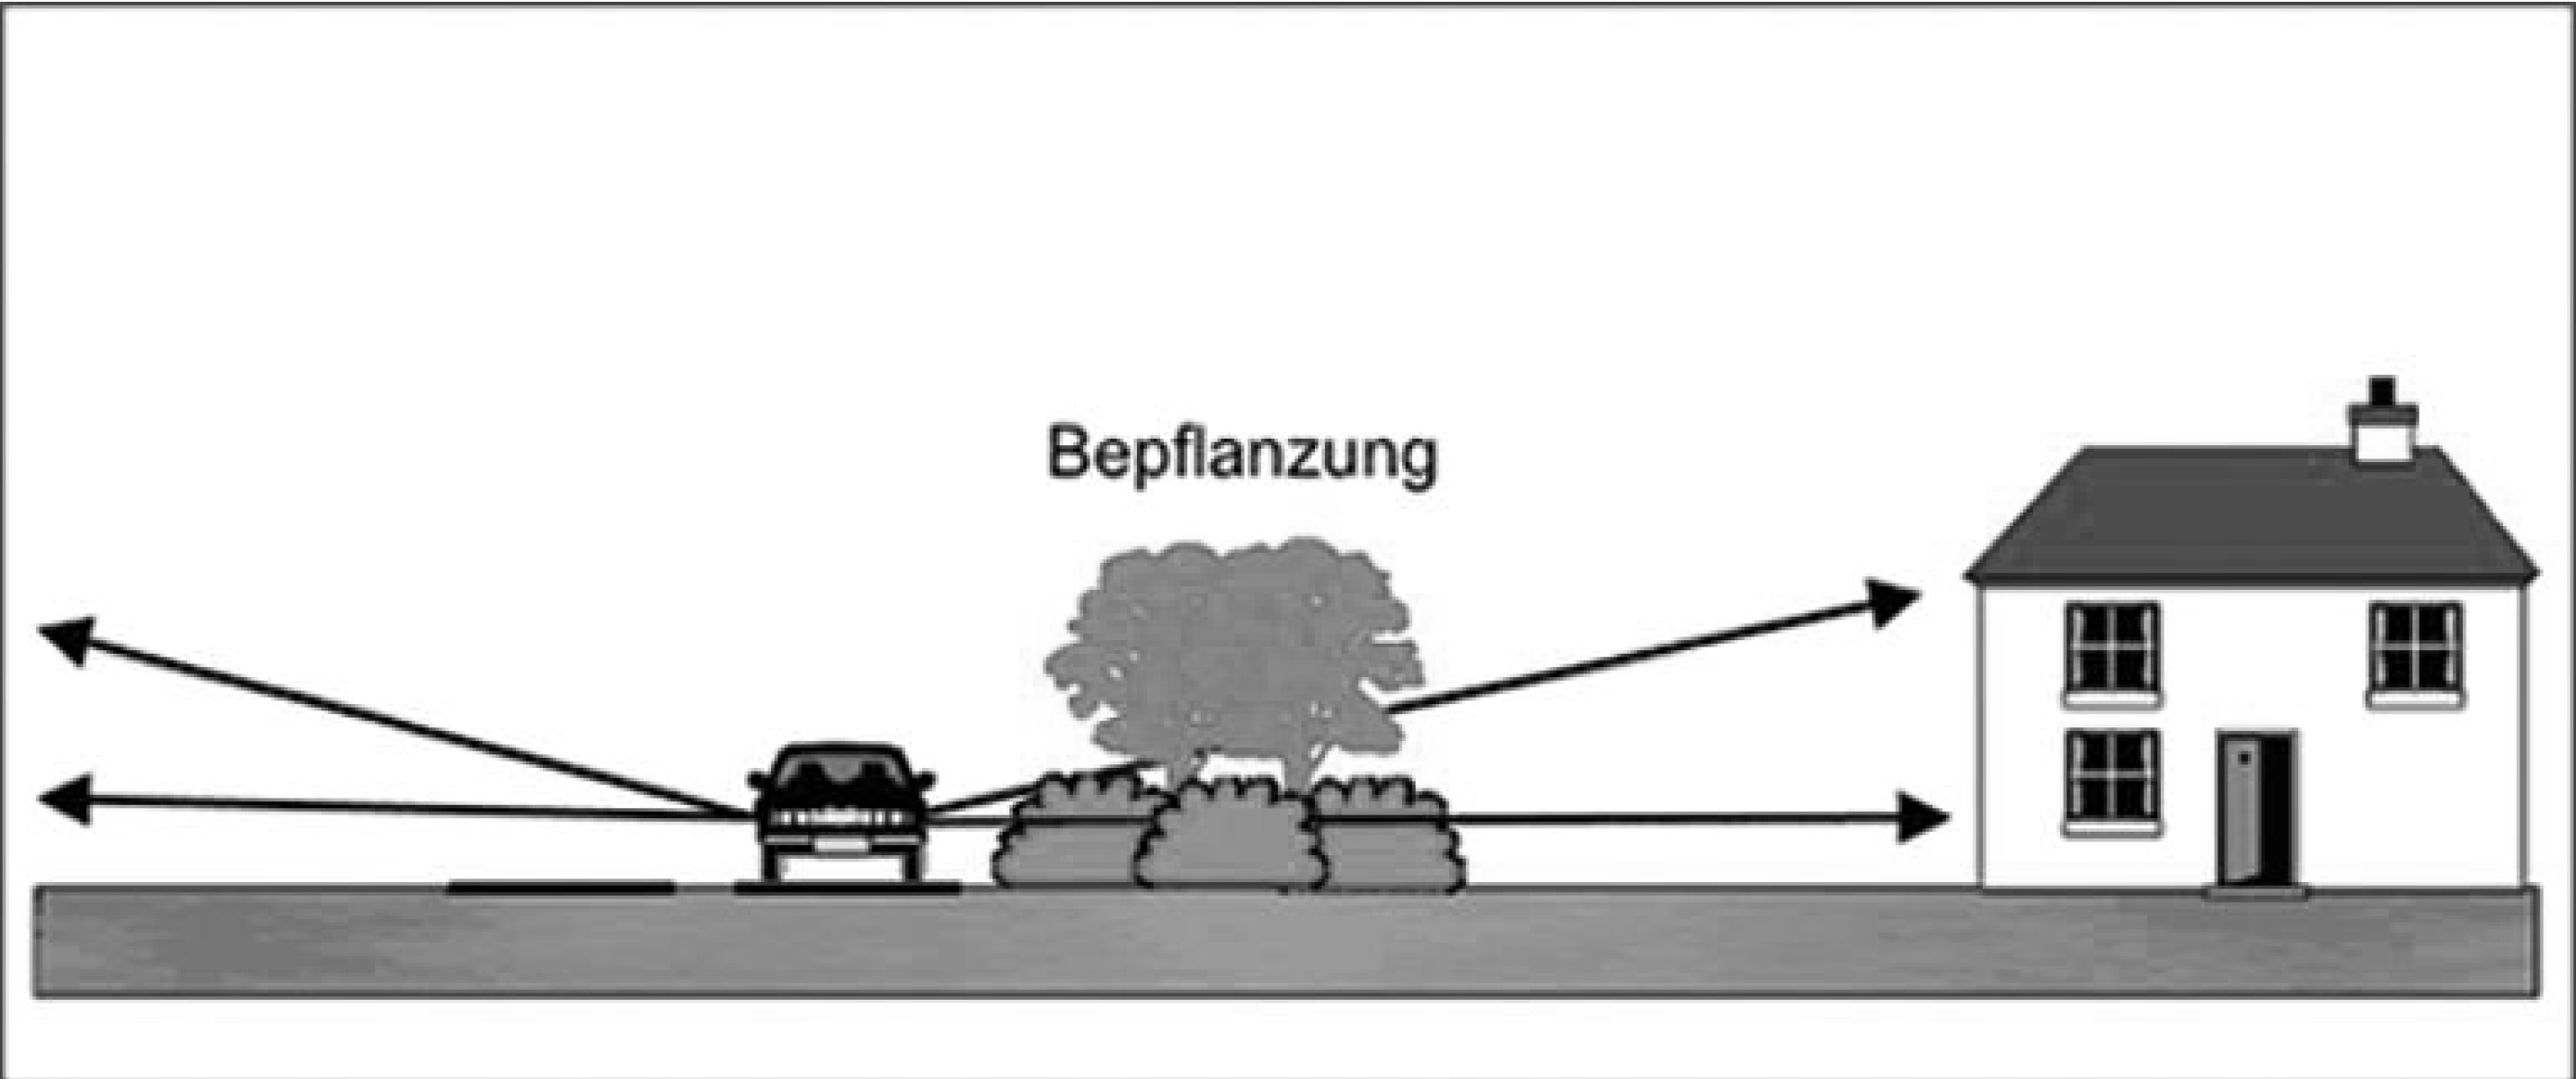
Planting hedges, green facades and trees puts soft surfaces between the traffic and the people. Instead of bouncing off hard walls, the sound gets absorbed and scattered, so the noise reaching the pavement is noticeably lower. As a bonus, the greenery makes it more pleasant to be in.
4.
Quality of stay (planting, urban furniture, fountains)
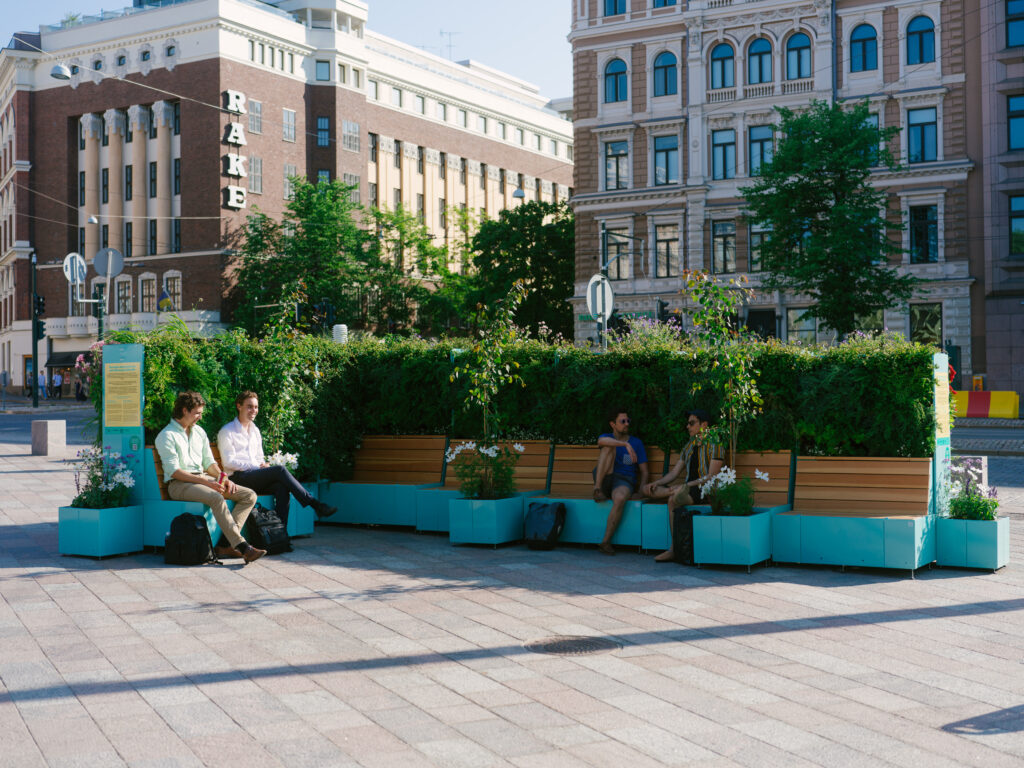
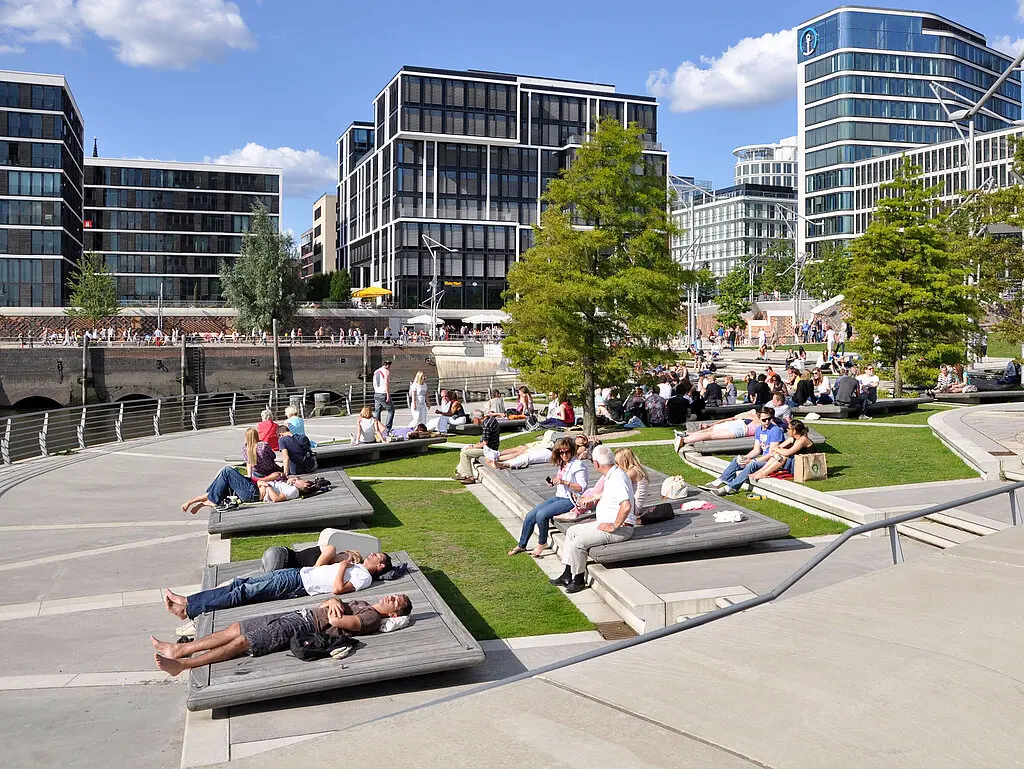
Adding planting, seating and a fountain turns the back of Wandsbek Markt into a place where people actually want to stay. The space feels quieter and more welcoming.
For this data story, we used AI tools in the following ways:
Claude for writing HTML code and supporting the visual design of the website.
Perplexity for revising and translating text.
Adobe Firefly for pre- and post-processing of maps.
The images themselves were not generated using AI. All image sources are credited on the website.