Greenland

Greenland is Melting

One of Earth's last great ice sheets is disappearing before our eyes. Greenland is one of the most rapidly changing environments on Earth, its mass loss driven by a complex system of atmospheric warming, ocean heat intrusion, and accelerating feedback mechanisms.

266 Gt/yr mass loss · 11 mm sea level rise · Arctic +3.3 ยฐC
SDG 13 ยท Climate Action

The Research Question

What is driving the accelerating loss of the Greenland Ice Sheet, how fast is it happening, and what does it mean for Arctic communities, global coastlines, and the decision-makers who must act?

Greenland holds enough ice to raise global sea level by roughly 7.4 metres. It is one of the most rapidly changing ice environments on Earth, and its mass loss is driven not by a single cause but by a reinforcing system of atmospheric warming, warm-ocean intrusion, and feedback mechanisms — particularly ice-albedo feedback and basal lubrication — that together make the situation difficult to reverse.

Local

Inuit communities in Ilulissat face direct cultural, economic, and physical consequences as sea-ice seasons destabilise.

Global

Greenland's contribution to sea-level rise already affects hundreds of millions of people in low-lying coastal regions.

Irreversible

Further destabilisation risks crossing tipping points in ocean circulation and ice dynamics that cannot be undone.

The Scale of the Melt (GRACE)

Satellite gravity measurements (NASA GRACE/GRACE-FO) reveal a staggering reality: Greenland has shed over 4,700 gigatonnes of ice since 2002. In the last 26 years alone, this melting ice has added 11 millimeters to global sea level rise, threatening hundreds of millions of people in low-lying coastal regions worldwide. Source: Our World in Data / NASA GRACE.

Surface Melt Dynamics & Feedback Loops

As greenhouse gas emissions elevate global temperatures, atmospheric warming over Greenland manifests primarily as widespread summer surface melt. Far from a passive response, surface melting triggers powerful self-reinforcing feedback mechanisms that accelerate the ice sheet's loss.

Extreme Melt Events

In July 2012, an intense atmospheric heat dome caused 97% of the ice sheet surface to experience melting simultaneously. Once a rare century-scale phenomenon, widespread melt events are becoming increasingly frequent as Arctic warming intensifies.

Ice-Albedo Feedback

Melting uncovers older, darker glacier ice and concentrates surface impurities. This drastic drop in surface reflectivity (albedo) causes the ice sheet to absorb significantly more solar radiation, fueling further rapid surface melting in a continuous cycle.

Basal Lubrication

Surface meltwater accumulates into supraglacial lakes and drains down thousands of meters through vertical shafts called moulins. Reaching the bedrock, this water lubricates the ice-bed interface, allowing glaciers to slide faster toward the ocean.

While surface melt transformation alters the upper ice layers, measuring the total ice sheet volume requires looking from above in three dimensions โ€” tracing how these processes translate into structural elevation changes across Greenland.

Surface Elevation Change (CryoSat-2)

The pattern is unmistakable: the high interior is slightly thickening from snow accumulation, while the margins are thinning rapidly. The map below visualises CryoSat-2 surface elevation change (dh/dt), built in Kepler.gl from the gridded NetCDF converted to CSV.

CryoSat-2 radar altimetry (SARIn mode) resolves the steep coastal margins for the first time. The main body of the ice sheet lowered at −13.3 cm/yr (2011–2021), while the northwest sector thinned at −21.9 cm/yr on average and up to −46.9 cm/yr at its margins. This coastal thinning is driven by ocean heat intrusion โ€” warm subpolar water undermining marine-terminating glaciers from below โ€” and by increased meltwater runoff. Source: ESA CryoSat-2 gridded elevation change (Copernicus Climate Data Store), visualised in Kepler.gl.

Glacier Retreat โ€” Jakobshavn Timelapse

Jakobshavn Glacier has retreated 35 km since 1850 โ€” the pace tripled after 2000. It now discharges roughly 46 kmยณ of ice into the ocean each year. Retreating past critical thresholds risks crossing tipping points into marine ice sheet instability, causing irreversible collapse regardless of future emissions cuts. Source: Google Earth Engine / Landsat.

Temperature Anomaly (Ilulissat)

At the local scale, Inuit communities in Ilulissat face direct cultural, economic, and physical consequences. Destabilised and unpredictable sea-ice seasons severely threaten their traditional hunting practices and coastal infrastructure.

Source: The Programme for Monitoring of the Greenland Ice Sheet (PROMICE) and the Greenland Climate Network (GC-Net). The file contains automatic weather station (AWS) data from the "JAR" station, which stands for the Jakobshavn Ablation Region on the Greenland Ice Sheet.

Greenland Topography

Explore the map of Greenland. Source: BedMachineGreenland_bed-v6, published by the National Snow and Ice Data Center (NSIDC).

Who Has a Stake?

Greenland's ice loss radiates outward from those living on the ice to the global institutions that shape climate policy. Hover or tap a ring to see who sits at each layer.

Core — Inuit communities

Hunters, fishers and families in Ilulissat whose sea-ice seasons, food security and cultural practices depend directly on stable ice.

Regional & national

Government of Greenland (Naalakkersuisut), Denmark, Arctic Council states, coastal-nation governments, insurers and re-insurers, and regional planners.

Global / Institutional
Regional & National
Directly Affected
Inuit communities
(Ilulissat)

Directly affected

Greenland's fishing industry, coastal infrastructure operators, tourism, and low-lying coastal populations worldwide exposed to sea-level rise.

Global & institutional

IPCC, UNFCCC, the scientific community (NASA, ESA, NSIDC, PROMICE), the EU, and global emitters whose decisions drive the underlying warming.

Theoretical Foundation

This question has been studied intensively. Our storymap builds on a mature body of peer-reviewed research, all of which points in the same direction: Greenland's mass loss is real, accelerating, and human-driven.

IMBIE Team (2020) — Nature

The Ice Sheet Mass Balance Inter-comparison Exercise combined 26 satellite datasets and found Greenland lost 3,902 ยฑ 342 Gt of ice between 1992 and 2018, raising sea level by 10.8 ยฑ 0.9 mm. The rate of loss rose roughly seven-fold, from 33 Gt/yr in the 1990s to 254 Gt/yr in the 2010s.

Read study โ†’

Mouginot et al. (2019) — PNAS

Reconstructed 46 years of mass balance across 260 drainage basins. Mass loss switched from a gain of +47 Gt/yr (1972–80) to a loss of 286 Gt/yr (2010–18) โ€” a sixfold increase โ€” with the northwest and southeast the largest contributors.

Read study โ†’

Otosaka et al. (2023) — ESSD / IMBIE

The latest IMBIE assessment reports the polar ice sheets lost 7,560 Gt (1992–2020). Greenland alone is responsible for almost two-thirds (13.5 mm) of the 21 mm of ice-sheet-driven sea-level rise since 1992.

Read study โ†’

Helm et al. (2014) — The Cryosphere

First CryoSat-2 elevation map of Greenland, measuring a volume change of −375 ยฑ 24 kmยณ/yr. Established the radar-altimetry method underpinning our elevation section.

Read study โ†’

IPCC AR6 (2021) — WG1

Confirms Arctic amplification (warming 2–4ร— the global average) and warns that sustained Greenland loss could commit the world to multi-metre sea-level rise over centuries, with tipping-point risk.

Read report โ†’

Nick et al. (2009) — Nature Geoscience

Showed that outlet-glacier acceleration, thinning and retreat are triggered at the calving terminus and propagate inland โ€” the dynamic mechanism behind Jakobshavn's rapid retreat.

Read study โ†’

Methods

Our workflow moved from question to evidence in four stages: choosing the right data, preparing it consistently, applying clear visualisation principles, and building each visual with a fit-for-purpose tool.

01

Data selection

We prioritised authoritative, open-access sources — NASA GRACE/GRACE-FO, ESA CryoSat-2, NASA GIBS/MODIS, PROMICE and GC-Net weather stations, NOAA Mauna Loa COโ‚‚, and BedMachine Greenland v6. Each dataset was selected to answer one specific sub-question: how much ice (mass), where it is changing (elevation), how it melts (surface cover), why (COโ‚‚ and temperature), and the terrain beneath it (topography).

02

Data preparation & processing

Time-series (mass, COโ‚‚, station temperature) were checked for gaps and expressed as anomalies against a stated baseline so trends are comparable. MODIS imagery was filtered to peak-melt July dates to isolate the melt signal. For elevation change, the gridded CryoSat-2 NetCDF was converted to CSV, cleaned, and imported into Kepler.gl for spatial rendering.

03

Visualisation choices

We matched each chart type to the question it answers. Mass loss and COโ‚‚ are cumulative trends, so they use line charts where the slope carries the message. Surface melt is inherently spatial and time-dependent, so it became an animated map that lets viewers watch the 2012 event unfold. Elevation change is a two-sided story — interior thickening versus margin thinning — so we used a diverging colour scale anchored at zero so the sign of change reads instantly. Throughout, we kept axes unbroken, labelled units explicitly, and let one idea lead each visual rather than crowding several signals into a single frame.

04

Tools

Each visual was built with the tool best suited to it: Datawrapper for line and anomaly charts, Leaflet + NASA GIBS for the animated surface-melt map, Kepler.gl for the elevation-change and 3D topography maps, Google Earth Engine Timelapse for glacier retreat, and Three.js for the narrative globe that frames the story.

Results & Recommendations

The data converge on one conclusion: Greenland is losing mass at an accelerating, human-driven rate, with the margins thinning fastest. From this, decision-makers can act.

What the data shows

  • Mass loss has accelerated roughly six- to seven-fold since the 1980s and now runs at ~266 Gt/yr.
  • The margins thin at up to ~47 cm/yr while the interior barely thickens โ€” loss is concentrated at marine-terminating outlets.
  • Surface melt extremes (97% in 2012) are becoming recurrent, amplified by ice-albedo feedback.
  • The driver โ€” atmospheric COโ‚‚ above 420 ppm โ€” continues to rise without slowing.

The Root Catalyst: Global Atmospheric COโ‚‚

Human-driven carbon emissions act as the primary global catalyst for Greenland's ice loss. Rising atmospheric COโ‚‚ levels (now >420 ppm) drive Arctic amplification (+3.3ยฐC warming). Curbing this global emissions curve through Paris Agreement mitigation targets is the only direct lever to arrest ice sheet destabilization. Source: Our World in Data / NOAA.

Practical recommendations

Mitigate

Accelerate emissions cuts aligned with the Paris Agreement and IPCC AR6 pathways โ€” the only lever that addresses the root driver and reduces tipping-point risk.

Adapt

Invest in coastal-defence and managed-retreat planning for low-lying regions, using Greenland loss as a leading indicator in sea-level-rise projections.

Protect communities

Fund Inuit-led adaptation in Ilulissat: safer ice-travel monitoring, diversified livelihoods, and infrastructure resilient to unstable sea-ice seasons.

Monitor

Sustain and expand satellite and in-situ observation (GRACE-FO, CryoSat-2, PROMICE) so early warning of instability keeps pace with change.

Alignment with research & policy

Our findings are consistent with IMBIE (2020, 2023), Mouginot et al. (2019) and IPCC AR6: independent methods all report accelerating, human-driven loss. This directly supports SDG 13 (Climate Action), the Paris Agreement temperature goals, and Arctic Council adaptation priorities. The policy case is clear โ€” investing now to cut emissions and protect exposed communities is far cheaper than the irreversible cost of crossing ice-sheet and ocean-circulation tipping points.

The Cost of Inaction

Sea Level Contribution: 11.0000000 mm

266 Gt/yr

Ice Mass Loss

35 km

Jakobshavn Retreat

97 %

Surface Melt (2012)

+3.3 ยฐC

Arctic Warming

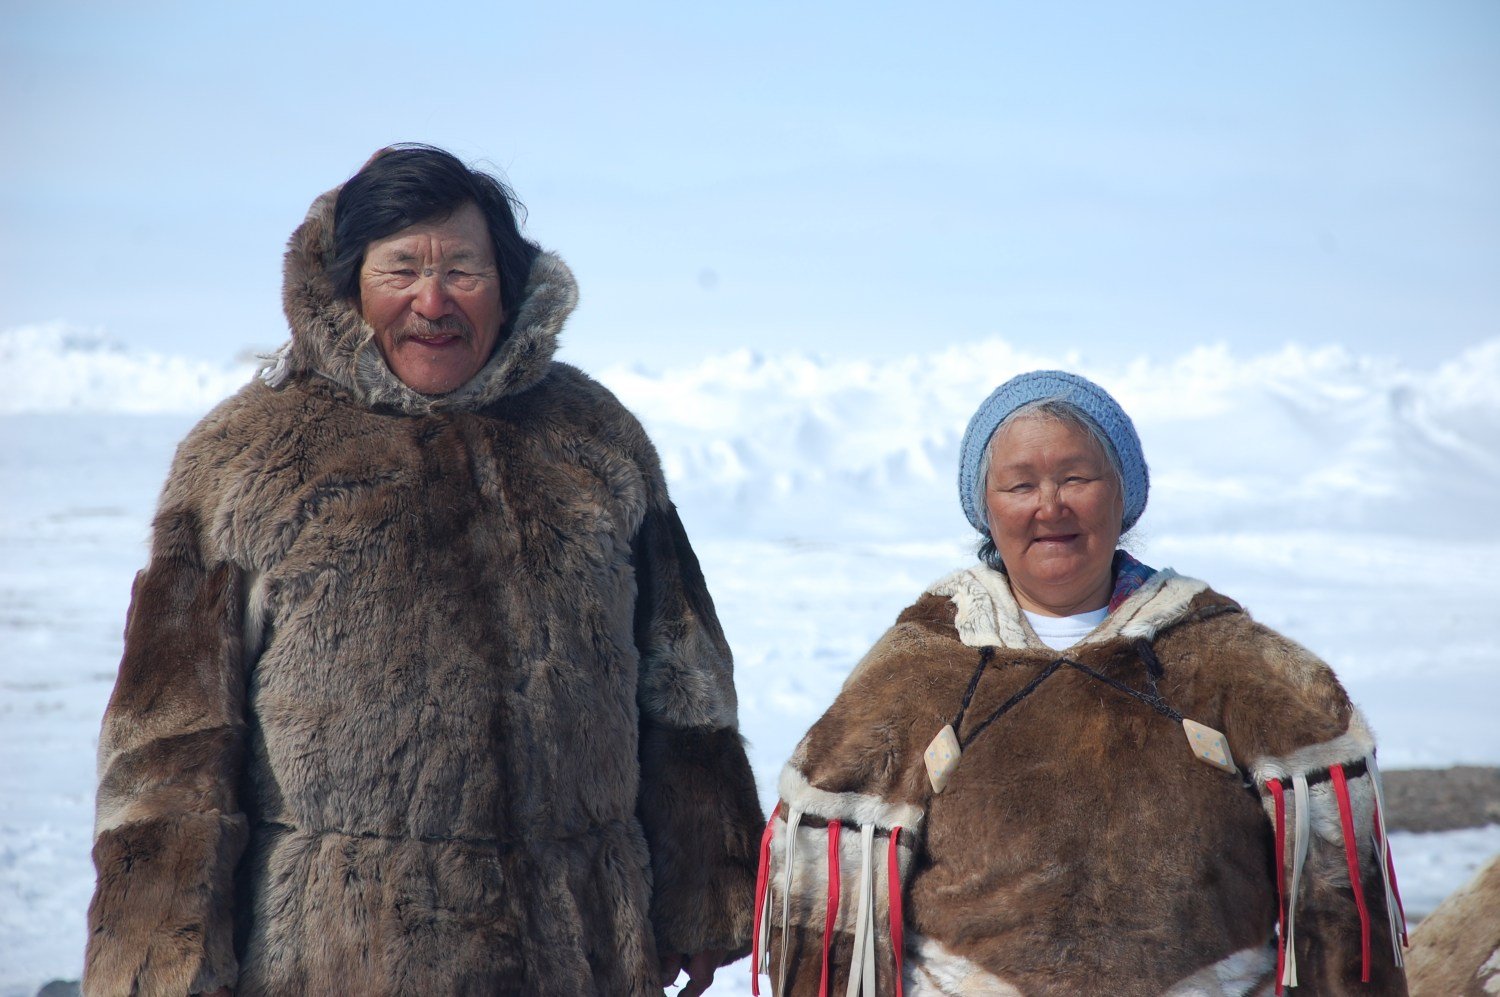
Inuit in traditional clothing

Image source: Arctic Kingdom

"The sea ice used to come in October. Now we wait until January. Our hunters cannot go out."
โ€” Inuit elder, Ilulissat.

Data Sources

Primary datasets utilized in the storymap visualization and analysis:

Extended Data Catalogue โ€” Additional Datasets Explored (Expand)

The following data catalogue lists datasets evaluated during our initial data exploration and research phase for broader global climate context, though not all were directly embedded in the final visual storymap:

Dataset Name Maintainer Link
ERA5 Reanalysis โ€“ Surface Temperature Copernicus / ECMWF Access Data โ†—
NOAA Global Surface Temperature (NOAAGlobalTemp) NOAA / NCEI Access Data โ†—
DWD Climate Observation Stations German Weather Service (DWD) Access Data โ†—
PSMSL โ€“ Permanent Service for Mean Sea Level (Tide Gauges) PSMSL / NOC Liverpool Access Data โ†—
Copernicus Emergency Management Service (CEMS) โ€“ Flood Maps European Commission / JRC Access Data โ†—
Global Flood Database (GFD) โ€“ Cloud-to-Street / NASA Cloud to Street / NASA Access Data โ†—
NOAA Coral Reef Watch โ€“ Bleaching Alert Areas NOAA / Coral Reef Watch Access Data โ†—
ReefBase Coral Bleaching Events UNEP Access Data โ†—
IBTrACS โ€“ International Best Track Archive for Climate Stewardship NOAA / WMO Access Data โ†—
IPCC AR6 Regional Projections IPCC / DWD Access Data โ†—