Maternal Healthcare Accessibility in the United States

SDG 3 · Good Health and Well-being

Maternal healthcare
is unevenly accessible.

Access to maternal healthcare is highly uneven across the United States. Geography, insurance coverage and healthcare infrastructure continue to shape maternal and infant health outcomes.

01

The Challenge

Maternal and infant health outcomes differ substantially across the United States. These differences raise questions about healthcare access, infrastructure and regional inequality.

02

The Approach

We combine state-level health outcomes, hospital data, insurance coverage and spatial visualisations to understand maternal healthcare accessibility.

03

The Finding

Maternal healthcare accessibility is shaped by geography, infrastructure and socioeconomic conditions, not only by medical care itself.

Theoretical Foundation

Understanding maternal healthcare accessibility

Maternal healthcare accessibility refers to the ability of pregnant people to obtain appropriate healthcare before, during and after childbirth. Accessibility is influenced by multiple dimensions, including the spatial distribution of healthcare facilities, travel distance, affordability, health insurance coverage and socioeconomic conditions. Access to care therefore depends not only on the availability of medical services but also on whether people can realistically reach and afford them.

Existing Research

Current knowledge on maternal mortality in the United States

Causes and measurement of maternal mortality

According to an article by Dilmaghani et al., the United States is the only developed country with an increasing maternal mortality rate. The article mentions different factors: an older age during pregnancy, obesity, more preexisting and additional illnesses, unintended births, C-Sections and suboptimal perinatal care, where women have four or fewer appointments during pregnancy (Dilmaghani et al., 2024, p.1).

Another reason for the statistical increase between 2003 and 2017 was the introduction of a new death certificate. It records whether a person was pregnant at the time of death, within the previous 42 days or between 42 days and one year before death (Dilmaghani et al., pp. 1-2).

Inequality in maternal health outcomes

Reports from maternal mortality review committees found that more than 60% of pregnancy related deaths could have been prevented (Dilmaghani et al., 2024, p.2). There are also clear racial differences. Between 2011 and 2013, the pregnancy-related mortality rate was 43.5 deaths per 100.000 live births for Black women, compared with 12.7 deaths per 100.000 live births for white women. Black women made up to 14.6% of live births but accounted for 37.9% of maternal mortality (Dilmaghani et al., 2024, pp. 2-3).

Healthcare systems and policy responses

One possible measure would be the introduction of better support for pregnant women. The California Maternal Quality Care Collaborative reduced maternal mortality in California by 55% between 2006 and 2013, at the same time the national maternal mortality rate increased (Dilmaghani et al., 2024, p. 3). In addition, Medicaid finances almost half of all births in the US. However, at the time described in the article, new mothers had to qualify for Medicaid again 60 days after giving birth. Because of that the article calls for Medicaid coverage to be extended to one year after birth to cover the high risk period better (Dilmaghani et al., 2024, p. 4).

Political influences on maternal healthcare

Political factors are also an important topic of maternal mortality. An article published by The Guardian in March 2026 shows that the maternal mortality increases in countries that strongly depend on development aid from the United States when a Republican president is in power. Republican governments often reduce aid for family planning. A study presented in the article found that cuts to family planning aid under Republican governments were associated with an 11% increase in maternal mortality. This is equal to around 45 additional deaths per 100,000 live births (Milman, 2026).

An article published by Time in April 2026 also discusses the general concern about political changes in maternal health. In 2024, more than one quarter of women of reproductive age with young children reported difficulties finding good maternity care. The article discusses the „One Big Beautiful Bill Act“, which includes large Medicaid cuts. According to this article, these changes are expected to leave more than 14 million additional people without health insurance by 2034 and at least ten million people could lose their Medicaid coverage (Psaki et al., 2026).

Visualisations

Following the data story

From outcomes to access

Deficient maternal healthcare accessibility can contribute to poorer maternal and infant health outcomes. The website therefore first identifies regional differences in mortality and then examines whether unequal infrastructure, spatial access, insurance coverage and social barriers may help explain these patterns.

01

Maternal mortality

Maternal mortality rate from 2019-2023 (per 100,000 births).

02

Infant mortality

Infant mortality rate in 2024 (per 1,000 births).

03

Relationship between maternal and infant mortality

The scatter plot compares maternal and infant mortality rates across U.S. states. Several states with higher maternal mortality also show elevated infant mortality, indicating a possible relationship between the two outcomes. However, the chart does not establish causality. The observed pattern may also be influenced by socioeconomic conditions, demographic differences, data quality and the limitations of state-level aggregation.

Understanding accessibility

Unequal outcomes cannot be understood without asking who can reach healthcare, who can afford it and which populations face additional barriers.

04 · Infrastructure

Hospital availability by state

Number of hospitals per 100,000 inhabitants by state. Normalising hospital numbers by population allows states of different sizes to be compared more meaningfully.

Interpretation Normalising hospital numbers by population provides a more comparable indicator of healthcare infrastructure than absolute hospital counts. However, the dataset includes all hospitals and does not distinguish maternity hospitals or obstetric facilities.
05 · Spatial access

Hospital density heatmap

Looking at hospital locations helps reveal where healthcare services are concentrated and where potential accessibility gaps may exist.

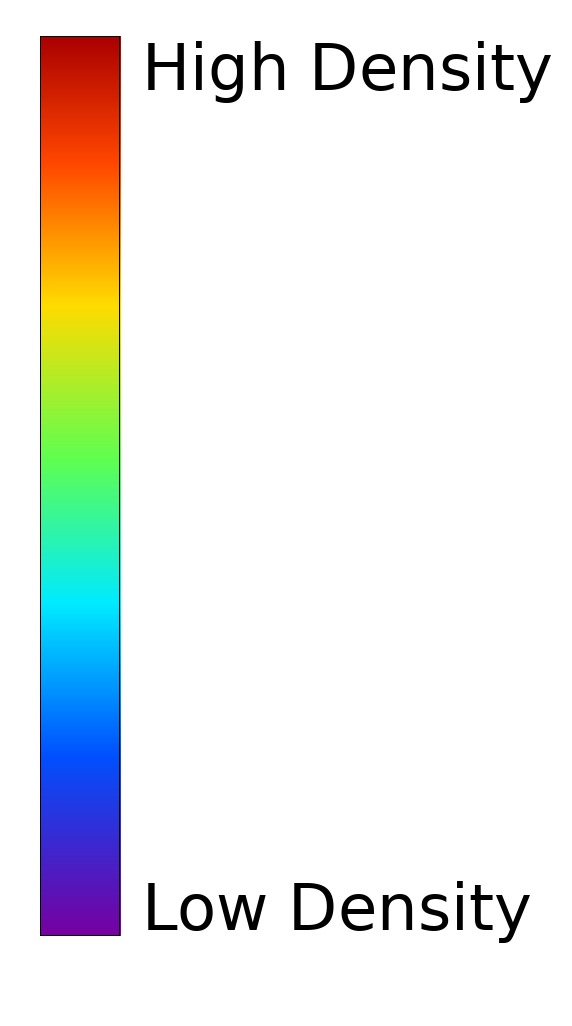
Legend for the hospital density heatmap
Interpretation The map highlights a strong contrast between urban healthcare concentration and lower-density rural areas. This may indicate that access to healthcare services differs considerably across regions and that travel distance could be an important factor in maternal healthcare accessibility.
06 · Affordability

Health insurance coverage

Physical access alone does not guarantee healthcare access. People also need the financial means and insurance coverage to use available services. People with more than one insurance type are counted in each category, so the total exceeds 100%. Unreported cases are not included in the chart.

Interpretation Insurance coverage adds another layer of inequality. Even where healthcare infrastructure exists, access to prenatal, delivery and postpartum care may remain limited by affordability and insurance status.
07 · Social barriers

Uninsured population by nativity

Social and legal conditions also affect access to healthcare. Foreign-born populations and non-citizens may face additional barriers to obtaining insurance coverage.

Interpretation The chart suggests that citizenship status may influence healthcare access. Non-citizens experience substantially higher uninsured rates, which may create additional barriers to maternal healthcare services.
08 · Care experiences

Home births

Whilst home births are legal in all 50 U.S. states, their frequency and the reasons for choosing them vary spatially. Common motivations include greater autonomy, fewer medical interventions, negative previous hospital experiences, fear of medical institutions and the preference for giving birth in a familiar environment.

Interpretation Home births increased substantially in the United States between 2016 and 2023. Regional differences may reflect personal preferences, previous care experiences and unequal access to maternity services. However, planned home births are associated with higher neonatal and perinatal risks than hospital births, particularly where access to emergency medical care is delayed.
09 · International comparison

Healthcare spending and outcomes

The United States spends substantially more on healthcare per capita than many comparable countries such as Norway and Taiwan, yet maternal health outcomes remain comparatively poor. This comparison raises questions about how healthcare systems are organised and who can actually access care.

Health expenditure per capita in 2024 compared across selected countries
Interpretation The comparison highlights a central paradox: despite exceptionally high healthcare expenditure, the United States continues to experience poorer maternal outcomes than many countries with lower spending levels.
10 · Stakeholders

Who shapes maternal healthcare accessibility?

Maternal healthcare accessibility is shaped by multiple actors, ranging from healthcare providers and families to insurers and public institutions. Their decisions influence the availability, affordability and quality of maternal healthcare services.

Stakeholder map of maternal healthcare accessibility
Interpretation Maternal healthcare accessibility is not determined by medical providers alone. Public institutions, legislation and economic actors strongly influence who can access care and under which conditions.

Analysis

Connecting the indicators

01

Unequal outcomes

Maternal and infant mortality reveal substantial regional disparities across the United States.

02

Unequal accessibility

Hospital infrastructure, spatial concentration and insurance coverage shape opportunities to receive care.

03

Unequal experiences

Different populations and places experience maternal healthcare differently, especially where legal, social or geographic barriers exist.

04

Key finding

Maternal healthcare outcomes are shaped not only by medical care itself, but also by unequal access to healthcare infrastructure and insurance coverage.

Recommendations

Why decision-makers should invest resources

01

Improve access

Expand maternal healthcare services in underserved and rural regions.

02

Strengthen infrastructure

Invest in maternity units, prenatal care and emergency obstetric services.

03

Reduce barriers

Improve insurance coverage and support vulnerable populations.

04

Improve data

Collect better local data on travel times, maternity services and accessibility.

Limitations

What the data cannot show

This website uses state-level data to identify broad patterns. However, state-level analysis cannot capture all local inequalities or individual experiences.

Next Steps

Future directions

Conclusion

Access is uneven, infrastructural and political.

Together, the visualisations show that maternal and infant health outcomes are closely connected to healthcare infrastructure, insurance coverage and the unequal spatial distribution of medical services across the United States.

Maternal healthcare accessibility should therefore be understood as a spatial and socioeconomic policy issue. Improving maternal health outcomes therefore requires investments not only in medical care itself, but also in healthcare infrastructure, affordability and regional accessibility.

Our findings are broadly consistent with the existing literature, which identifies healthcare accessibility, insurance coverage and socioeconomic inequalities as important factors influencing maternal health outcomes. They also support current public health strategies that emphasise improving access to maternal care, strengthening healthcare infrastructure and expanding insurance coverage.

Methods

Methodological approach

This project combines publicly available health and demographic datasets with spatial visualisation techniques to explore maternal healthcare accessibility across the United States. State-level indicators were collected, processed and visualised using choropleth maps, comparative charts, an interactive hospital density map and stakeholder mapping to examine different dimensions of healthcare accessibility.

Data collection & processing

Several methods were used for selecting and preparing the datasets. Publicly available datasets from sources such as the CDC, U.S. Census Bureau, OpenStreetMap and other statistical databases were collected to represent different dimensions of maternal healthcare accessibility. For the geospatial hospital location data, Overpass Turbo was used to extract hospital locations from OpenStreetMap. Additional datasets were processed using Microsoft 365 Excel and QGIS 3.40.12. Interactive maps were created using uMap, while charts and other visualisations were produced using Datawrapper. The selected indicators include maternal and infant mortality, healthcare infrastructure, insurance coverage, social factors and birth practices.

Analytical framework

These indicators were selected to represent different dimensions of accessibility: health outcomes, physical availability, financial access and social barriers. They were chosen to examine how different spatial and socioeconomic conditions may influence maternal healthcare accessibility. The analysis combines different indicators to examine maternal healthcare accessibility from multiple perspectives. Maternal and infant mortality rates were used as outcome indicators, while hospital distribution, spatial accessibility, insurance coverage and social factors were analysed as potential factors influencing healthcare access. The visualisations were not interpreted individually but considered together to identify broader patterns of spatial inequality. This approach allows the project to explore how healthcare infrastructure, affordability and regional differences contribute to unequal maternal and infant health outcomes across the United States.

Website implementation

The website was developed using HTML, CSS and JavaScript. Interactive Datawrapper visualisations and the uMap application were integrated into a responsive web interface. The project files are organised into structured folders containing datasets, scripts, styling and website files and were published via GitHub Pages.

Coming from an architectural background, Helene was mainly responsible for the visual and technical implementation of the website, including the overall layout, colour palette, typography, navigation structure and integration of the interactive visualisations.

AI-assisted development

AI tools (VS Code Copilot and ChatGPT) were used to support coding challenges, debugging and language refinement during the development of the website. The website concept, analytical structure, data selection, interpretation and visualisation design were developed independently by the project team. AI tools were not used for collecting, processing or analysing the project data. Nina used ChatGPT 5.5 with a ChatGPT Plus subscription to generate an initial Overpass Turbo query for filtering hospital locations in the United States. The generated code was subsequently reviewed, adapted and simplified manually. No further AI tools were used for other parts of Nina’s work.
View ChatGPT conversation ↗
View Overpass Turbo query ↗

Project workflow

During the project, multiple datasets were collected, compared and evaluated before selecting the final indicators presented on this website.

The workbook documents the datasets considered during the project, including their sources, accessibility, relevance and limitations.

Download project workbook (.xlsx)

Data Catalogue

Datasets used in this project

The following catalogue summarises the datasets considered during this project. It includes the data source, accessibility, intended use and potential limitations of each dataset.

01

Maternal mortality

Source
CDC

Access
Public

Used for
Choropleth map

Description
Maternal mortality rate per 100,000 live births (2019-2023).

Why included
Primary indicator for evaluating spatial inequalities in maternal health outcomes.

Limitations
State-level data cannot capture local inequalities or explain causal relationships.

02

Infant mortality

Source
CDC

Access
Public

Used for
Choropleth map

Description
Infant mortality rate per 1,000 live births (2024).

Why included
Used to compare maternal and infant health outcomes across states.

Limitations
Does not account for socioeconomic or healthcare-related factors.

03

Hospitals by state

Source
Esri & U.S. Census Bureau

Access
Public

Used for
Hospital availability chart

Description
Hospital numbers by state combined with U.S. Census population data to calculate hospitals per 100,000 inhabitants.

Why included
Population-normalised values allow meaningful comparisons of healthcare infrastructure across states.

Limitations
Includes all hospitals and does not distinguish maternity or obstetric facilities.

Open dataset ↗

04

Hospital locations

Source
OpenStreetMap / Overpass API

Access
Public, custom query

Used for
Interactive heatmap

Description
Spatial dataset containing hospital locations across the United States.

Why included
Used to visualise regional differences in healthcare infrastructure and hospital density.

Limitations
Data quality depends on voluntary OpenStreetMap contributions and may vary regionally.

Open dataset ↗

05

Health insurance coverage

Source
U.S. Census Bureau

Access
Public

Used for
Stacked column chart

Description
Distribution of health insurance types in the United States (2024).

Why included
Different insurance types influence access to healthcare and therefore maternal and infant health outcomes.

Limitations
Insurance categories may overlap and do not necessarily represent actual access to maternal healthcare.

Open dataset ↗

06

Uninsured population by nativity

Source
U.S. Census Bureau

Access
Public

Used for
Grouped bar chart

Description
Dataset showing the proportion of uninsured residents by nativity.

Why included
Nativity and citizenship status can influence access to healthcare through differences in insurance coverage.

Limitations
Undocumented populations are likely underrepresented in official statistics.

Open dataset ↗

07

Home births

Source
Statista

Access
Public, PDF only

Used for
Choropleth map

Description
Dataset showing the number of home births by U.S. state in 2023.

Why included
Home births provide an additional perspective on maternal healthcare accessibility and regional care practices.

Limitations
Home births represent only a small share of births and may be underreported.

Open dataset ↗

Data Catalogue

References

01

Increasing Maternal Mortality in the United States

Dilmaghani et al. (2024)

Source
Mayo Clinic Proceedings

Used for
Maternal mortality trends, contributing factors, racial disparities and healthcare interventions.

Description
Article analysing the increase of maternal mortality in the United States and discussing demographic, medical and systemic causes.

Reference
Dilmaghani, D., Nath, K. A., & Garovic, V. D. (2024). Increasing maternal mortality in the United States: Looking beneath and beyond the numbers. Mayo Clinic Proceedings, 99(6), 873-877.

Open article ↗

02

Maternal Mortality in US Aid-Dependent Countries

Milman (2026)

Source
The Guardian

Used for
Political influences on maternal mortality and international health policy.

Description
Article discussing the relationship between reductions in US family planning aid and maternal mortality outcomes.

Reference
Milman, O. (2026). Maternal mortality rises in US aid-dependent countries under Republican presidents, study shows.

Open article ↗

03

Maternal Health Policy

Psaki et al. (2026)

Source
Time

Used for
Current debates around Medicaid coverage and maternal healthcare policy.

Description
Article discussing potential consequences of changes in maternal health policy and healthcare coverage.

Reference
Psaki, S., Kass, D., & Tobin-Tyler, E. (2026). A dangerous shift in maternal health policy.

Open article ↗

04

Home Births in the United States

Grünebaum & Chervenak (2024)

Source
Journal of Perinatal Medicine

Used for
Trends, motivations and health risks associated with home births in the United States.

Description
Article discussing why women choose home births and comparing neonatal and perinatal risks across birth settings.

Reference
Grünebaum, A., & Chervenak, F. A. (2024). Why do women choose home births? Journal of Perinatal Medicine, 52(6), 575-585.

Open article ↗

About

About this project

Project

BYOD · Bring Your Own Data!

SDG 3 · Good Health and Well-being

HafenCity University Hamburg · 2026

Method

State-level mapping, indicator comparison, stakeholder mapping and spatial interpretation.

Data

CDC, HRSA, KFF, U.S. Census Bureau, OpenStreetMap, uMap and Datawrapper.

Authors

Ahlvers, Veit

Eisermann, Nina

Kuba, Helene