Exploring the challenges of urban cycling infrastructure and safety in Germany's second largest city.
Let's BeginWe conducted a thorough search for statistics on biking in Hamburg and subsequently visualized our findings in the following charts. This section provides a brief look into these general statistics about bike riding in the city.
This chart shows the number of injured and killed cyclists in Hamburg from 2011 to 2024. The data reveals fluctuating safety trends, with noticeable peaks in certain years indicating increased danger for cyclists.

This chart compares how Hamburg residents choose to travel in the city. It highlights that cycling ranks behind cars and public transport, suggesting infrastructure and cultural barriers to bike adoption.

This heatmap reveals when accidents are most likely to occur, showing clear patterns in cycling accidents throughout the week. The darkest areas indicate peak accident times during weekday rush hours, particularly in the evening commute period.
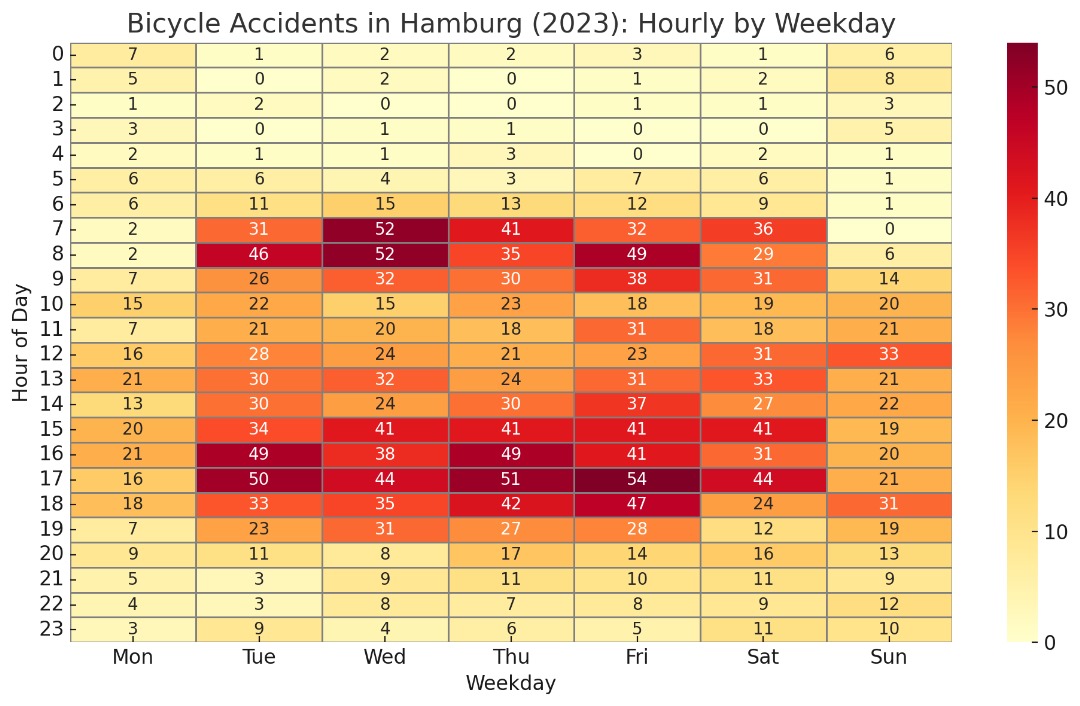
Source: Unfallatlas Statistikportal. Visualization created by the authors.
This chart shows accident rates per kilometer for different bike lane types in Hamburg. Protected lanes have 69% fewer accidents than painted lanes, demonstrating the urgent need for infrastructure upgrades.
This section presents a focused case study exploring how different types of cycling infrastructure relate to accident patterns in Hamburg. Two streets were selected based on their comparable cyclist traffic volumes but contrasting design features: Lombardsbrücke with an unprotected (painted) bike lane, and Hannoversche Straße with a protected (physically separated) bike lane. By examining spatial data, route characteristics, and reported incidents along these corridors, the aim is to provide a closer look at how infrastructure conditions vary across the city.
This map displays the heatmap of exact locations of bicycle accidents along two selected cycling routes in Hamburg highlighting the overall density and intensity of incidents. The route that runs along Hannoversche Straße, which includes a protected bike lane, shows noticeably fewer accidents and is marked in blue. In contrast, the route along Lombardsbrücke, where bike infrastructure is less developed and unprotected, is marked in red and shows a higher concentration of accidents. The visual highlights how infrastructure type corresponds with the frequency of reported incidents.
Methodology: We selected two streets with similar bicycle traffic volumes (~1,200 cyclists/day via Strava heatmap data) but different infrastructure:
Despite comparable usage, Lombardsbrücke had 3.2× more accidents (2021-2023 data). This confirms that infrastructure quality—not just cyclist volume—drives safety outcomes.
Sources: Strava Metro heatmap (2023), Unfallatlas accident data (2021-2023)
Left: Hannoversche Straße – Safe Design A protected bike lane, clearly separated from traffic and pedestrians, ensures safe cycling. Right: Lombardsbrücke – Conflict Zone The bike lane runs between traffic and a bus stop, forcing dangerous interactions when buses arrive.
Left: Hannoversche Straße – Comfortable Ride Cyclists benefit from a well-designed, protected lane with no conflicts. Right: Lombardsbrücke – Unsafe Conditions Cyclists are squeezed between traffic and buses crossing the lane to stop, creating daily hazards.
Physical separation results in:
Painted lanes lead to:
Protected lanes reduce accidents by up to 69% compared to painted lanes.
Lombardsbrücke and Stresemannstraße need urgent upgrades based on accident density.
Every €1 spent on protected lanes saves €3 in healthcare and accident costs.
Hamburg must prioritize protected bike lanes on high-risk corridors to achieve its 2030 cycling goals and reduce traffic fatalities.
Our initial question — why biking isn’t appealing in Hamburg — can now be answered through three key findings: insufficient infrastructure, unequal safety across corridors, and lack of equity in policy focus.
Our analysis draws from multiple data sources to understand cycling infrastructure and safety in Hamburg. Below is a catalogue of key datasets used in this project.
| Name | Maintainer | Access | Relevance to Cycling | Obstacles/Problems |
|---|---|---|---|---|
| Hamburg Geoportal | (public)City of Hamburg | Free and open | Contains cycling infrastructure data (lanes, parking, accidents). Useful for spatial analysis of cycling safety gaps. | Data may lack real-time updates or granularity (e.g., no congestion metrics). |
| HCU Geodata Portal | HCU | Free and open | Potential academic studies on urban mobility/cycling in Hamburg. | Access restricted to HCU affiliates; require permissions. |
| OpenStreetMap | Crowdsourced,foundation | Free and open, download of data possible via overpass-turbo, quickosm plugin in QGIS or Geofabrik | Crowdsourced cycling paths, accidents, and barriers. High flexibility for custom extracts (e.g., via Overpass Turbo). | Data quality varies; need cleaning/validation. |
| Bundesamt für Kartographie und Geodäsie (BKG) | BKG Germany | Free and open | German-wide transport networks (e.g., roads, bike paths). Useful for comparative analysis. | Not Hamburg-specific; need filtering. |
| HVV Open Data Portal | Hamburg Transport Association (HVV) | Free and open | Public transport schedules/traffic flow. Can highlight competition with cycling (e.g., "last-mile" gaps). | No direct cycling data. |
| GeoFabrik Downloads | GeoFabrik GmbH | Free and open | Pre-processed OSM data for Hamburg. Faster than raw OSM. | Static snapshots (not real-time). |
| DESTATIS - Mobility and Transport Data | Federal statistical office | Free and open | Contains official statistics on traffic accidents, including those involving cyclists, which is crucial for identifying accident hotspots and improving cycling safety. | The data is grouped together and might not show the detailed location information needed to study specific intersections in Hamburg. |
| Mobilithek (Germany) | BMDV/BASt | Free and open | A central portal for discovering various German mobility datasets, potentially including more granular cycling data from different sources not listed individually. | It works like a search engine; the quality and detail of the cycling data depend on the original source you find through it. |
| Strava | Private | Only preview data visible, access to full data requires payment | Shows popular cycling routes (indirectly highlights unsafe gaps). | Paid API; free version lacks detail. |
| TomTom Traffic Index | TomTom | Reports public, full data requires purchase | Provides insights into general traffic congestion, which can indirectly indicate areas where cycling might be a more attractive alternative or where cycling infrastructure is needed to bypass car traffic. | No direct cycling data; focuses on motorized traffic. Full detailed data is costly. |
| Stadtrad Hamburg | Deutsche Bahn Connect GmbH | Partially open, some data on request | Bike-sharing usage data but not accessable. Shows demand patterns. | Partial openness; some parts require requests. |
| Twitter/Instagram | Users/API | Free/Paid | Tracks complaints about cycling infrastructure (e.g., #HamburgCycling). | Noise from unrelated posts; requires NLP filtering. |
| World Bank Transport Indicators | World Bank | Free and open | Offers macro-level data on transport infrastructure and modal splits, useful for benchmarking Hamburg's cycling progress against other cities or countries. | The data is very general and doesn't have enough detail for specific urban planning or infrastructure decisions in Hamburg. |
| European Data Portal | EU Institutions | Free and open | EU-wide transport policies/cycling initiatives (benchmarking). | Broad scope; Hamburg-specific data scarce. |
| OpenNRW - Mobility and Transport | Ministry of Home Affairs, Local Government, Construction and Digitalization of the State of North Rhine-Westphalia | Free and open | Provides an example of regional open data initiatives for cycling infrastructure (bike networks, parking) that Hamburg could learn from or compare with. | This data is only for North Rhine-Westphalia (NRW), so it doesn't directly apply to Hamburg. It's more useful as a comparison. |
| Federal Motor Transport Authority (KBA) Vehicle Data | Kraftfahrt-Bundesamt (KBA) | Public (free; some detailed reports paid) | Focuses on registration and statistics of motorized vehicles, which can help assess car dominance or pressure on cycling infrastructure. | No direct cycling data; primarily focused on motorized vehicles. Only provides high-level aggregated data, not specific traffic patterns relevant to cycling routes. |
Our analysis relied on multiple data sources to understand Hamburg's cycling infrastructure challenges. We followed a systematic approach:
QGIS
Spatial analysis
Python
Pandas, GeoPandas
Datawrapper
Interactive charts
Juxtapose
Comparisons
Flourish
Data visualization