Traffic Accidents in Hamburg
Research Question: Where do most traffic accidents occur in Hamburg and what factors contribute to them?
Research Question: Where do most traffic accidents occur in Hamburg and what factors contribute to them?
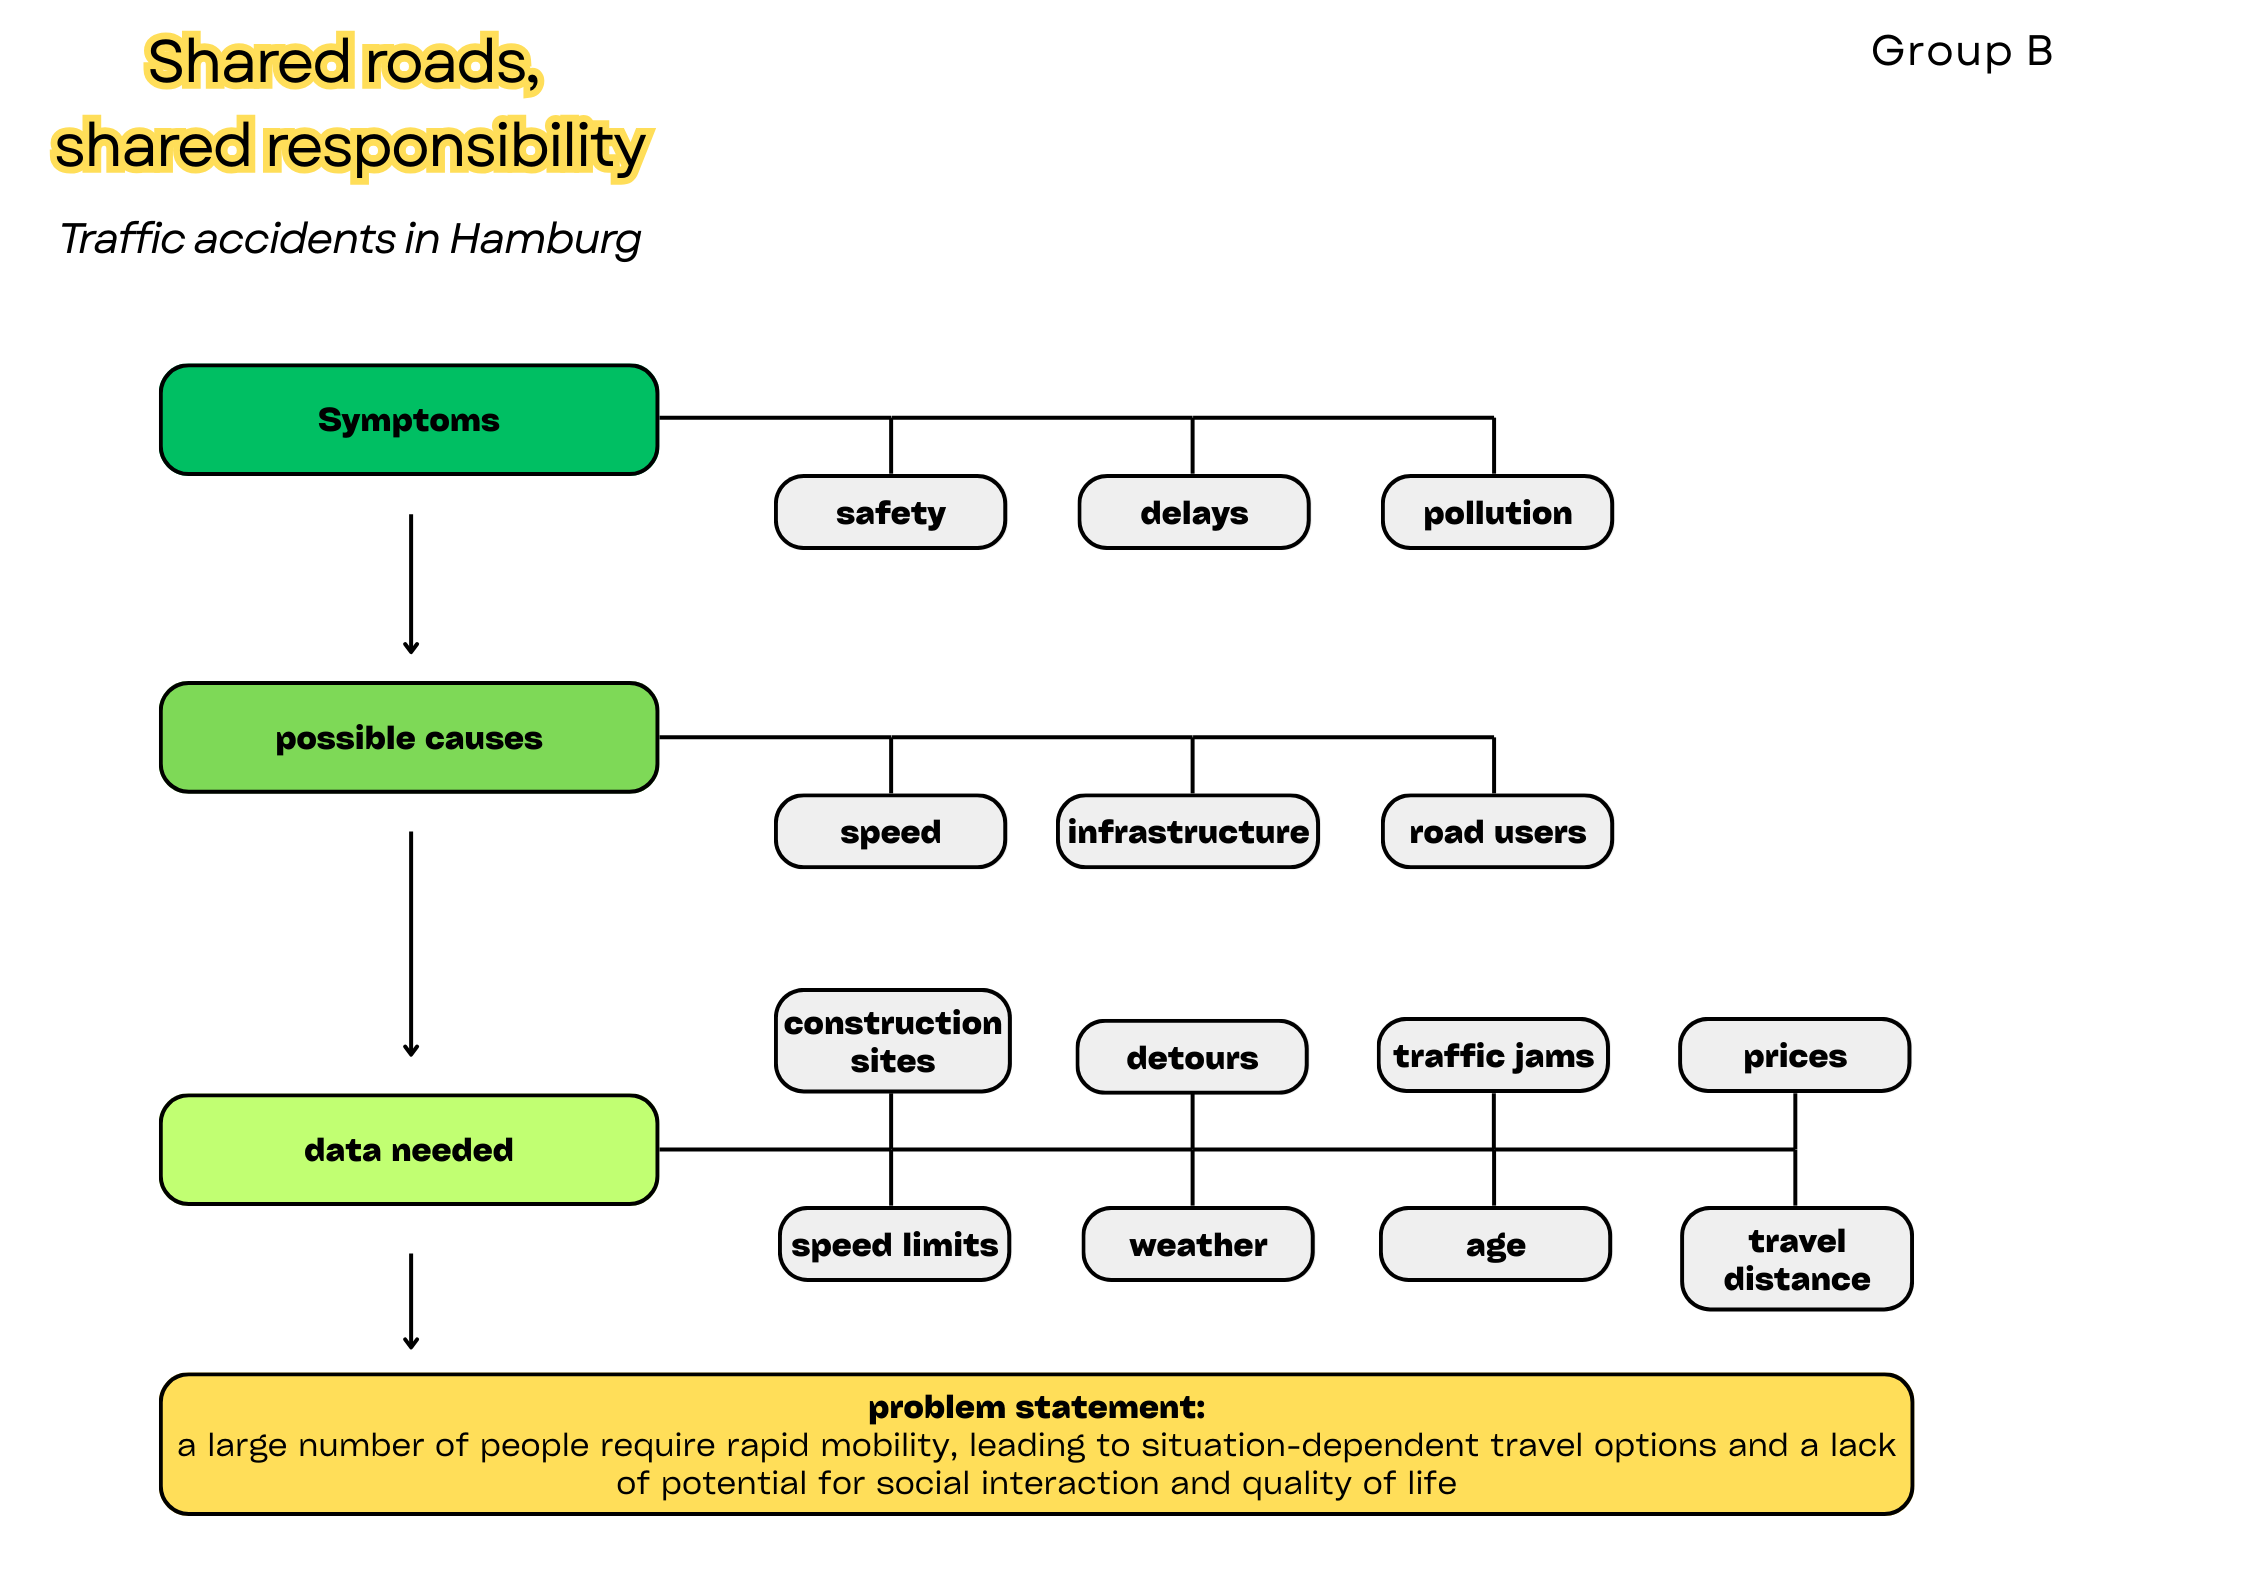
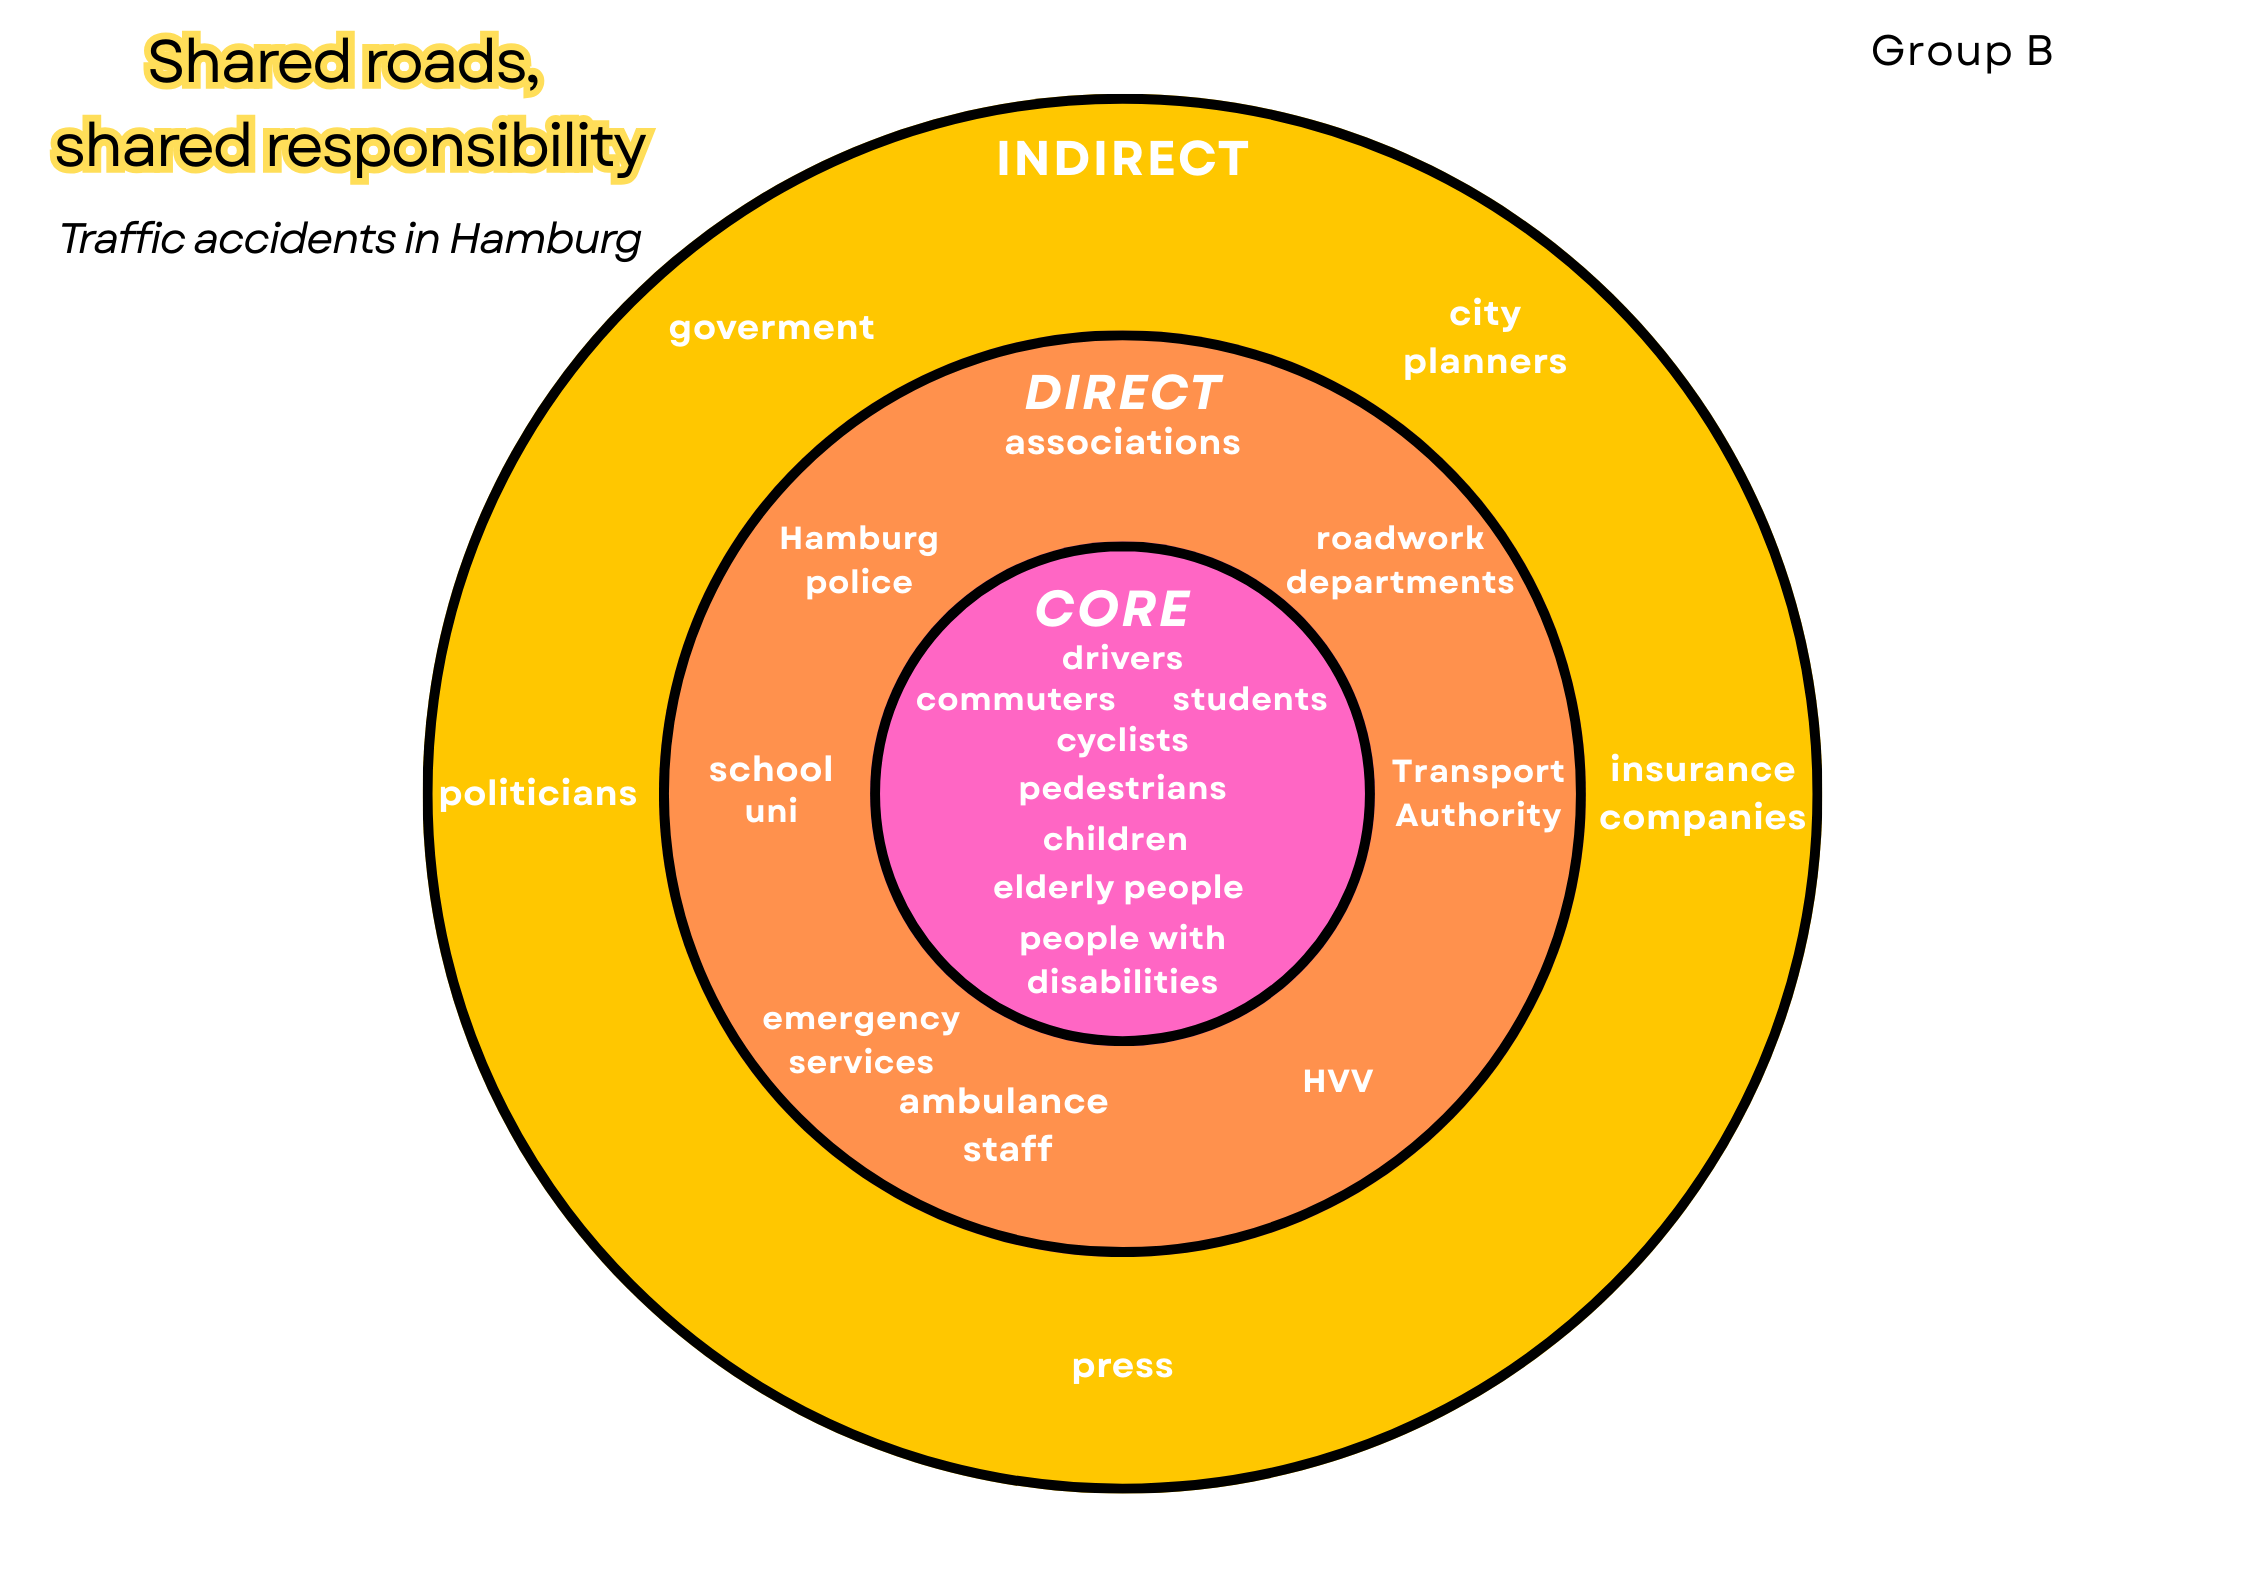
These diagrams analyze traffic accidents in Hamburg by outlining key symptoms, causes, and necessary data. They also map the shared responsibilities among core users, direct stakeholders, and indirect influencers in the urban mobility system.
This Kepler map shows recorded traffic accidents across Hamburg based on GPS data, overlaid with the bicycle route from Hamburg Central Station to Stadtpark, highlighting the likelihood of accidents along the route.
The development of cyclist injuries and fatalities in Hamburg over the past few years shows slight year-to-year fluctuations, but overall a rising number of injuries, with a peak in 2022. Although injury numbers decreased slightly in 2023, that year recorded the highest number of cyclist deaths. This progression calls for increased safety measures.
The distribution of accident involvement among car users, cyclists, and pedestrians reveals that most people involved in accidents are car users, followed by cyclists. Pedestrians account for only a small share of those affected.
This bar chart shows the number of accidents by time of day. It highlights typical peak periods for traffic incidents, with noticeable spikes in the afternoon hours.
This chart shows traffic accidents with personal injury in Hamburg by weekday in 2023, with the highest number occurring on Thursday and noticeably fewer incidents on weekends.
This chart shows the distribution of traffic accident causes leading to personal injury in Hamburg in 2024, with the most common being speeding and errors while turning.
This table compares the length of road types and total traffic accidents across German federal states in 2023, showing how infrastructure size correlates with accident volume.
This embedded view shows the official interactive accident atlas of Germany. You can zoom, pan, and explore accident locations directly from the federal statistics portal.
Compared to the rest of Germany, Hamburg has a relatively low number of traffic accidents. That is why we need comprehensive data on traffic accident statistics as well as background information on Hamburg's urban and transport planning. This allows us to apply successful approaches to other cities and help improve their planning strategies. At the same time, the data also helps us optimize Hamburg itself by identifying accident numbers and causes in relation to the city's relatively small area, so we can work on further reducing traffic accidents.