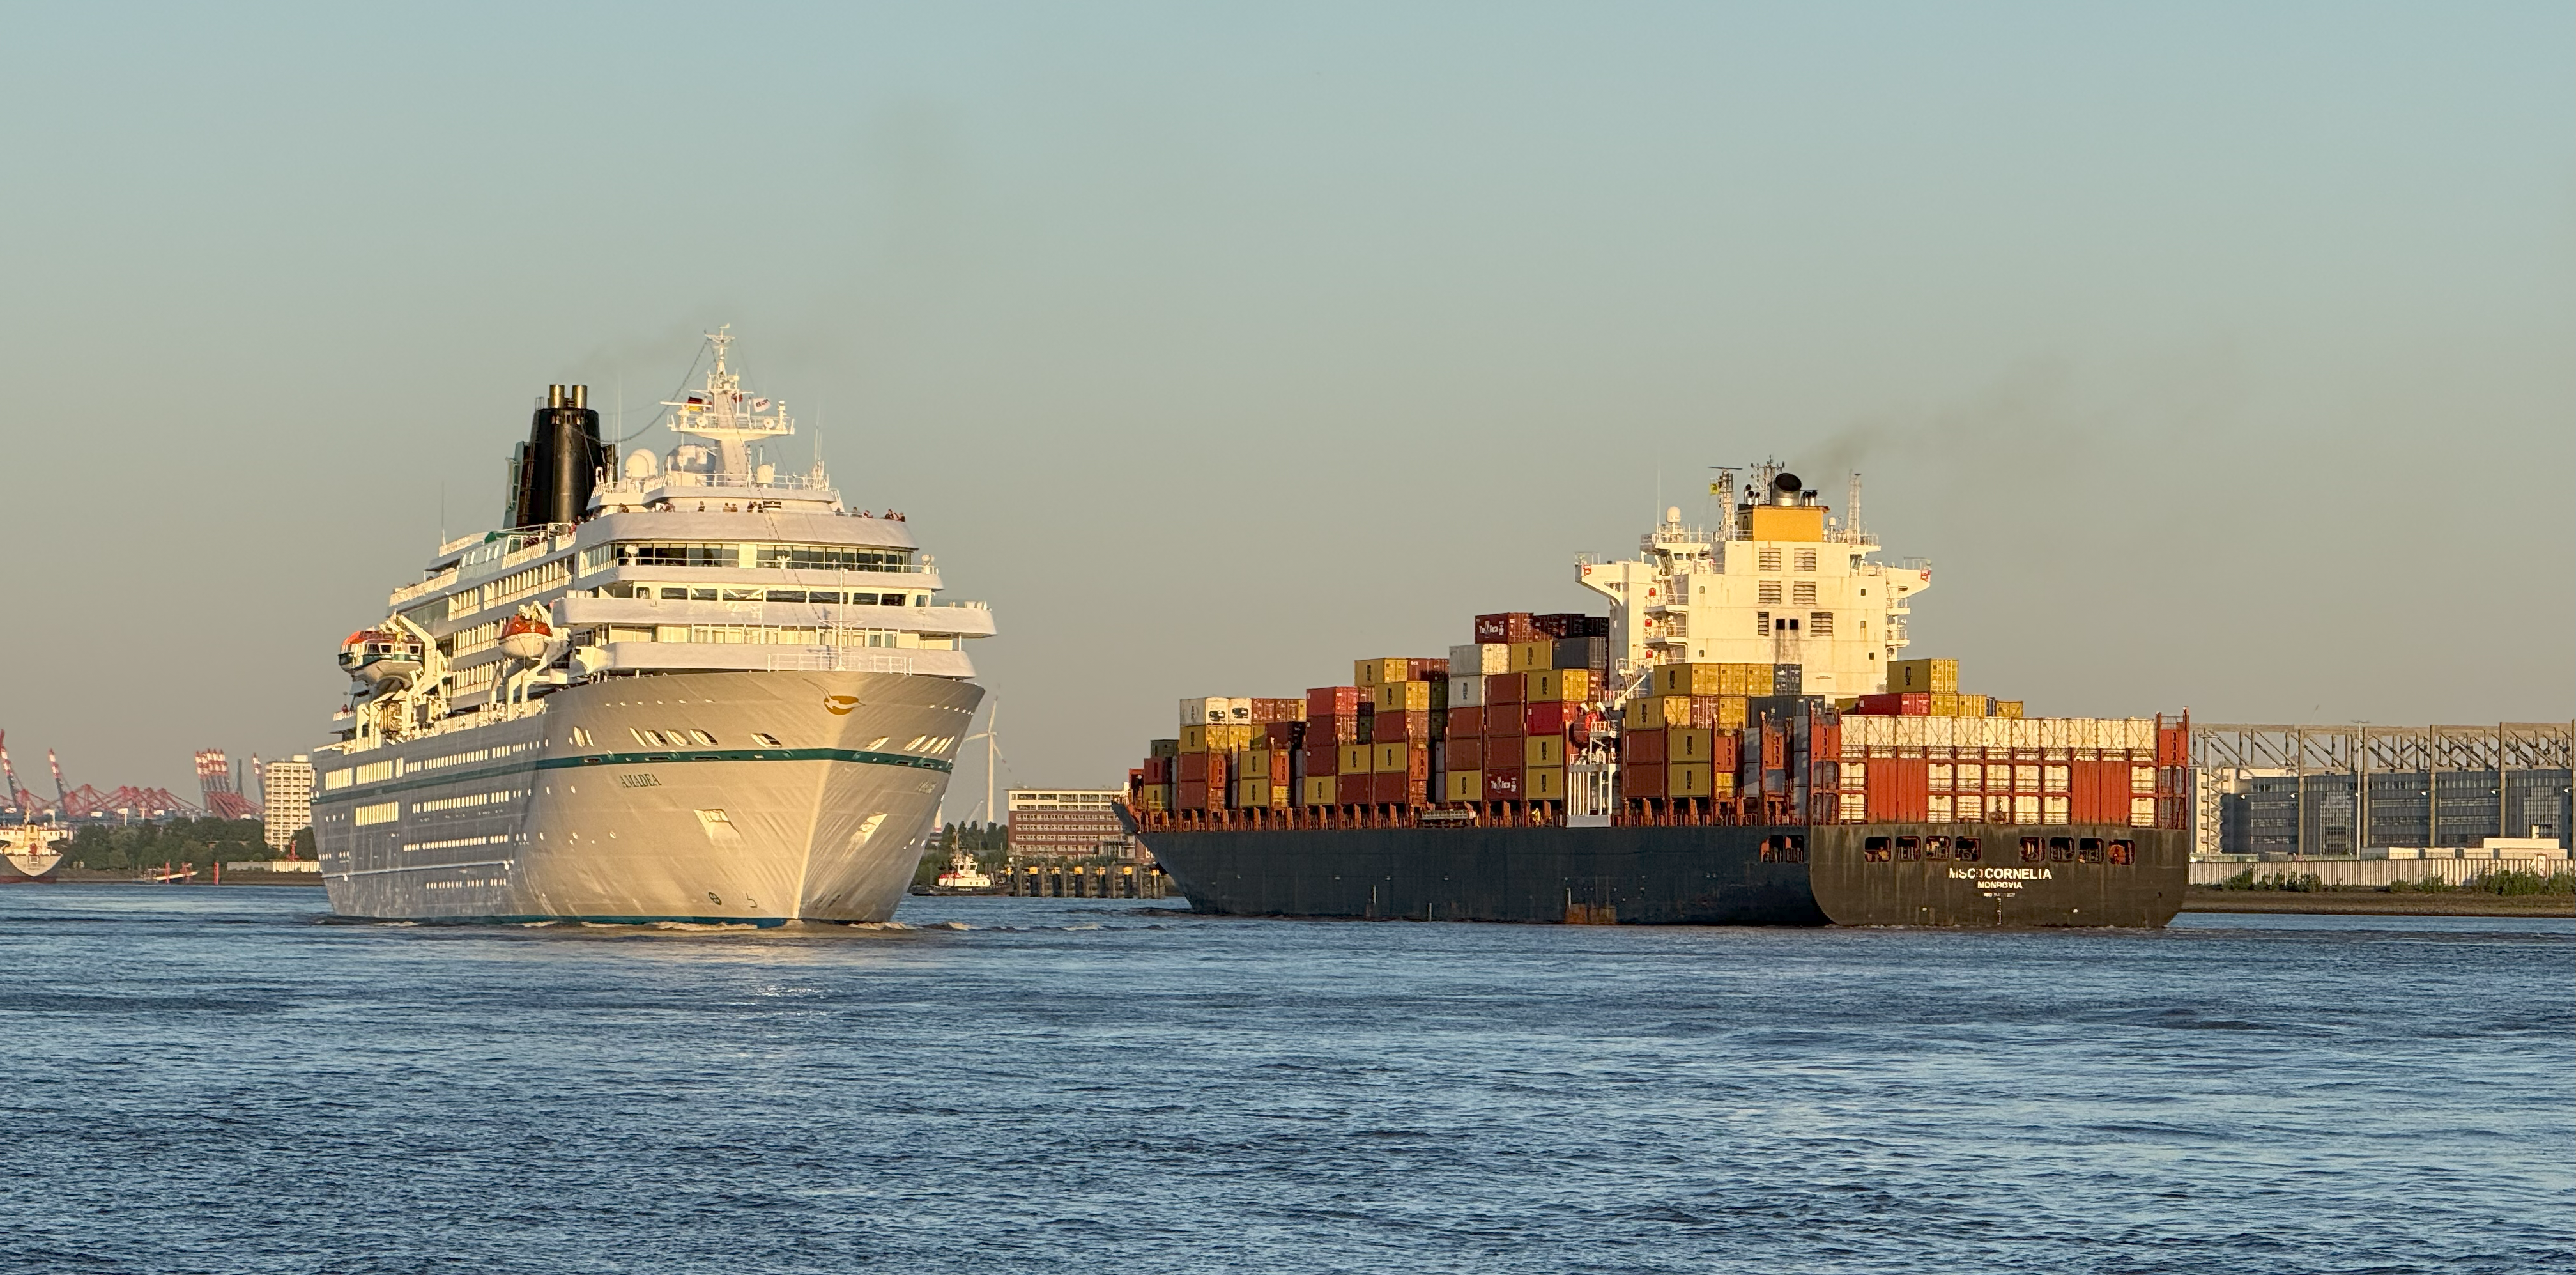
Tracing Ship Emissions in the Heart of Hamburg's Harbour
Image taken by Peter Kondakov
Problem Statement and Project Proposal
Shipping and industry in Hamburg emit harmful pollutants that affect air quality and health. Residents and tourists are particularly affected, especially in the newly developed Hamburg Hafencity. Poor air quality can lead to pollution-related illnesses, including respiratory diseases such as asthma and chronic obstructive pulmonary disease (COPD) or cardiovascular problems such as heart attacks and strokes, and even certain types of cancer.
However, as there is no localized real-time emissions data, it is difficult to determine when and where pollution is at its highest. The project raises awareness of this issue. In the future, there will also be recommendations for the people who live there.
The project proposes a tool that can combine real-time data on ship movements and information on wind directions and air quality to show people when they are most affected and warn them or prompt them to change their behaviour.
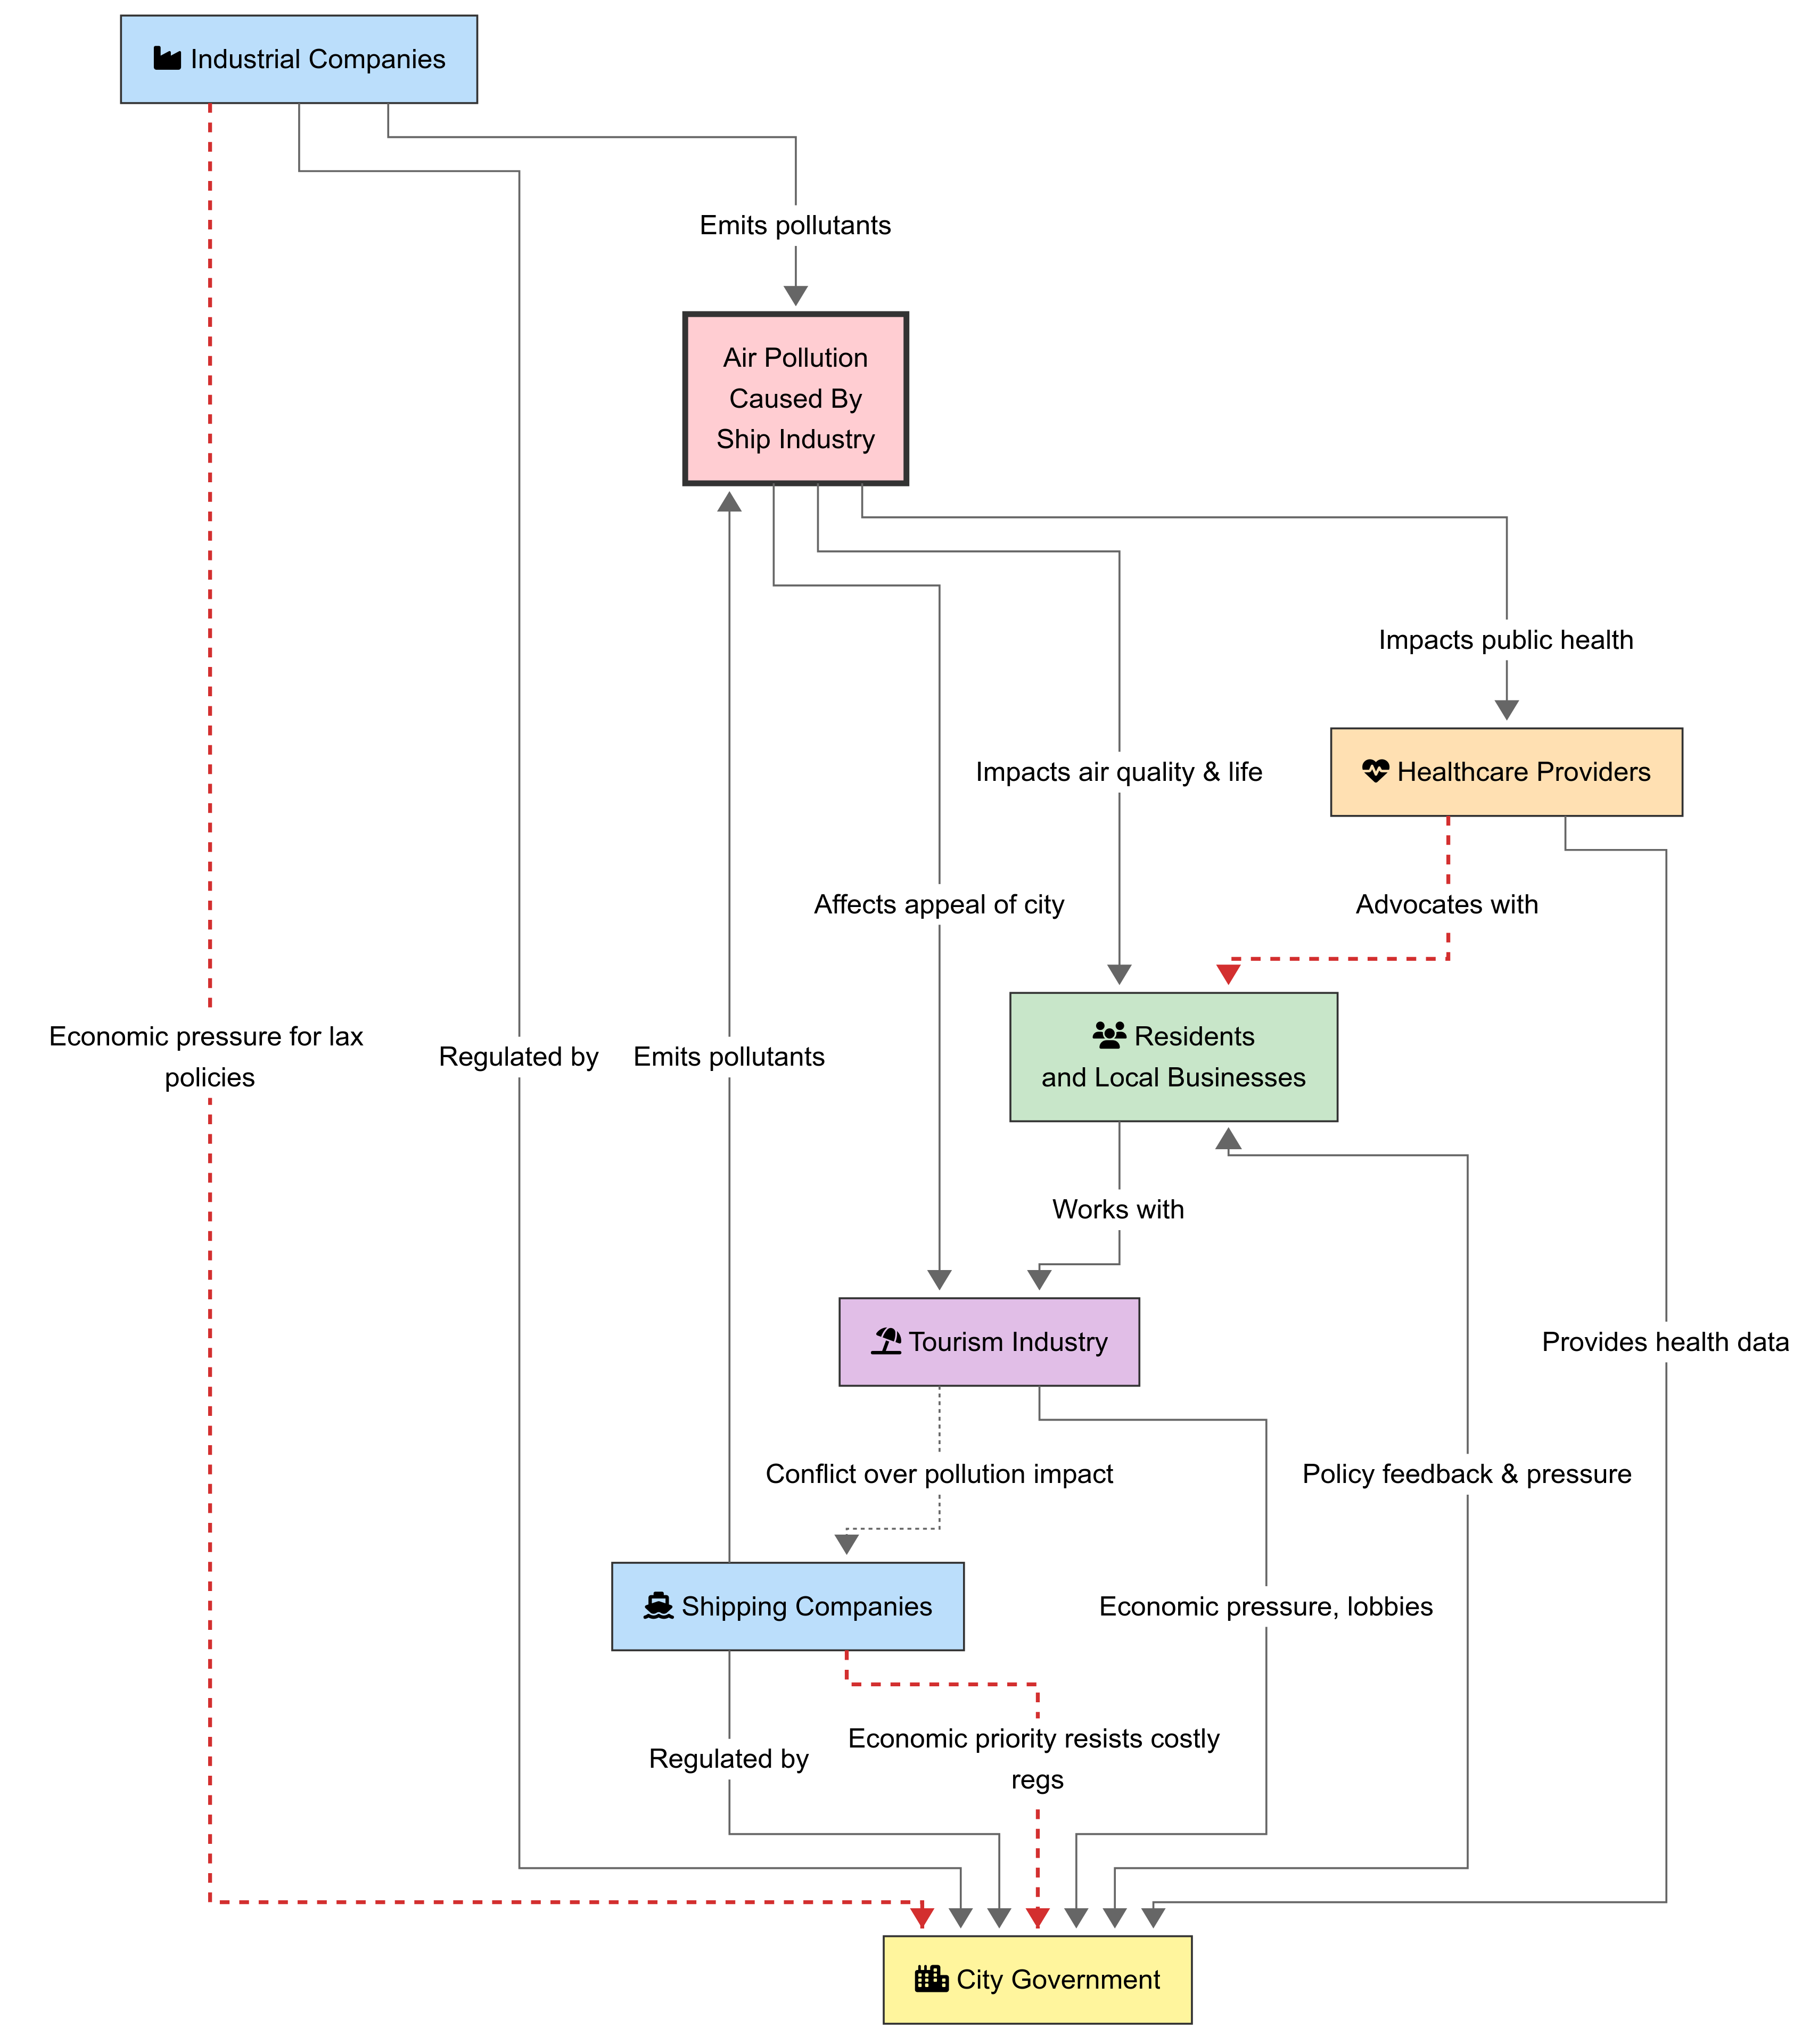
This stakeholder network map illustrates the relationships and influences around air pollution from the ship industry. It shows how industrial and shipping companies emit pollutants, impacting public health, city appeal, and quality of life. Residents, healthcare providers, and the tourism industry respond with advocacy and policy pressure, while economic actors lobby for lax regulations. The city government stands at the center, balancing competing interests.
Air Quality and Pollutants
Air pollutants from human activities, such as transportation, industry, and shipping, pose serious risks to human health and the environment. Key pollutants include nitrogen dioxide (NO₂), sulfur dioxide (SO₂), and particulate matter (PM), all of which are commonly found in urban and coastal areas. These substances can cause respiratory and cardiovascular problems, contribute to acid rain, and worsen climate change. The graphs below illustrate typical concentrations and trends of these pollutants, followed by brief descriptions of their sources and impacts (Sorte et al, 2020 & Jonson et al, 2020).
Concentration of Pollutants affecting Air Quality
This chart illustrates the relative concentration of pollutants contributing to air quality issues across regions.
Notice the dominance of PM2.5 and NO₂, which are key indicators of urban air quality.
Nitrogen Dioxide (NO₂)
Nitrogen dioxide is a reddish-brown gas primarily produced from burning fossil fuels, especially in vehicles and power plants. It contributes to respiratory problems and aggravates asthma and other lung diseases. NO₂ also plays a major role in forming ground-level ozone and particulate matter. Long-term exposure can decrease lung function and increase the risk of respiratory infections.
Sulfur Dioxide (SO₂)
Sulfur dioxide is a colorless gas with a sharp smell, mainly released from burning coal and oil at power plants and in industrial processes. It can irritate the eyes, nose, throat, and lungs, and is especially harmful to people with asthma. SO₂ also reacts in the atmosphere to form fine particulate matter and acid rain. Short-term exposure can cause respiratory symptoms and reduced lung function.
Particle Matter(PM)
Particulate matter (PM) consists of tiny solid or liquid particles suspended in air, including dust, soot, and smoke. PM is categorized by size: PM₁₀ (coarse particles) and PM₂.₅ (fine particles), with PM₂.₅ posing greater health risks due to its ability to penetrate deep into the lungs. Exposure can lead to heart and lung diseases, strokes, and premature death. Major sources include combustion engines, industrial processes, and natural sources like wildfires.
Annual emissions of air pollutants worldwide from 1990 to 2022
Global emissions of carbon monoxide (CO) decreased by roughly 29 percent between 1990 and 2022, to 425 million metric tons. By volume, CO is the most produced air pollutant worldwide among major types. It is a product of the incomplete burning of carbon in fuels from a variety of sources, including motor vehicles, boilers, and certain industrial processes.
How do Ships affect Air Quality?
Shipping activities have a significant impact on the health level of port cities. This impact is influenced by the mediating variable of air quality and has a partial mediating effect. Shipping activities not only emit a large amount of exhaust gas, leading to deterioration of air quality, increasing the risk of illness and death for port city residents, but also affecting the average life expectancy of port cities through other means, such as water pollution, noise pollution, accidents, and port terminal operations as well as hinterland connectivity.
According to The Federal Maritime and Hydrographic Agency (BHS), in coastal regions and port cities, ship exhaust significantly contributes to air pollution. Vessels primarily release trace gases like nitrogen oxides (NOₓ), carbon dioxide (CO₂), and sulfur dioxide (SO₂), along with soot and particulate matter. These emissions adversely affect human health, the environment, and the climate (Bundesamt für Seeschifffahrt und Hydrographie, n.d.).
Air pollution emissions from shipping worldwide in 2022, by pollutant type
Nitrogen oxide (NOx) emissions from global shipping totaled 18.5 million metric tons worldwide in 2022. That same year saw the global shipping fleet emit 3.7 million metric tons of sulfur dioxide (SO2). Global SO2 emissions from shipping have fallen sharply since 2019, owing to strict new rules on marine fuels introduced by the International Maritime Organization in 2020.
The largest Ports by annual Container Throughput
The largest ports shown on the map in terms of container throughput play a crucial role in global trade, but also contribute significantly to poor air quality. These ports handle millions of TEUs (Twenty-foot Equivalent Units) annually, resulting in high emissions from ships, cargo handling equipment and trucks. The concentration of diesel-powered vehicles and ships in these areas releases large amounts of nitrogen oxides (NOx) and particulate matter (PM), which degrade air quality and pose a health risk to the surrounding communities. While efforts are underway to electrify equipment and enforce cleaner fuel standards, pollution remains a pressing issue in these busy maritime hubs.
The Role of the Harbour Hamburg
The Harbour of Hamburg is the biggest seaport of Germany and the third biggest in Europe. The container handling in the Port of Hamburg averages around 24,000 standard containers (TEU) per day (Port of Hamburg: Growth in container throughput and rail transport, 2025).
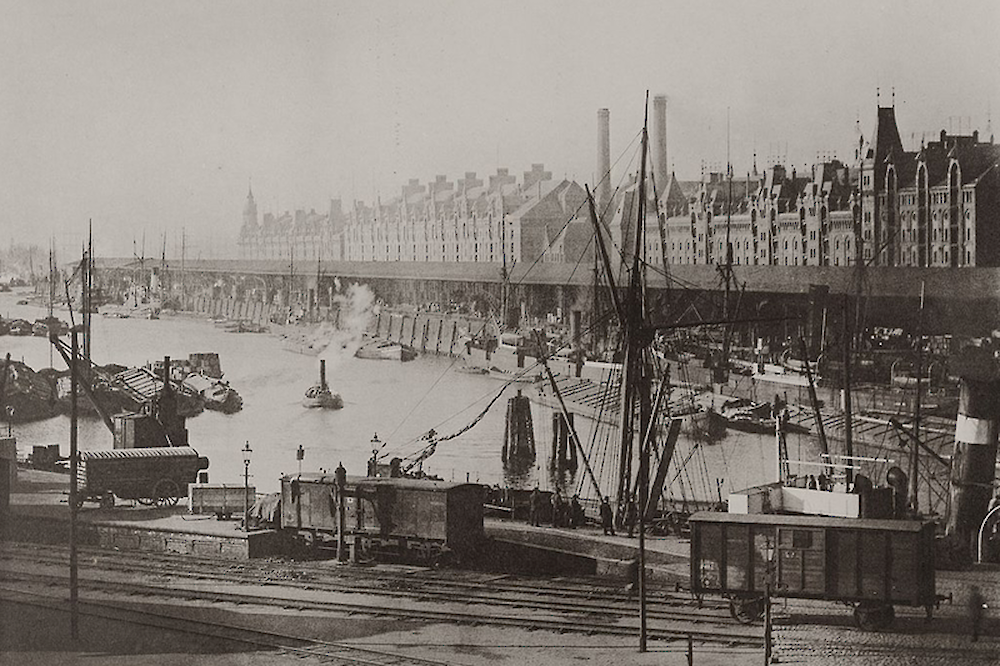
The Port of Hamburg - How it all began...
There was already a small port in Hamburg in 830, but this harbour was not the origin of today's harbour.
The actual foundation of the harbour dates back to 1188. The location at the mouth of the Alster into the Elbe
with a good access to the North Sea made the area ideal for a harbour. The beginning of the heyday of trade is
May 7, 1189, when the people of Hamburg granted duty-free access for ships for the first time (History of the port of Hamburg, n.d.).
The Port of Hamburg is a universal port that offers suitable handling facilities for every type of goods - from general cargo in containers to mass goods and liquid goods. More than 50 handling facilities ensure a smooth handling on an area of over 71 square kilometers. Around 290 berths offer space for all kind of ships. The terminals can be sorted by the kind of handling of the goods. They are spread between Steinwerder, Waltershof, Altenwerder, Moorburg, Reiherstieg, Wilhelmsburg, and Veddel. The terminals in Altenwerder and Waltershof are container terminals. Altenwerder is one of the most modern and efficient container terminals in the world. The processes are largely automated. Automated Guided Vehicles (AGVs) move the containers across the site and software-controlled cranes sort them in the block storage area (Terminals, Port of Hamburg, n.d.).
The AIREA project has revealed that ship exhausts significantly contribute to poor air quality in the harbor area, with elevated levels of sulfur dioxide (SO₂), nitrogen dioxide (NO₂), and fine particulate matter (PM2.5) serving as key indicators of this pollution. These pollutants are critical for assessing urban air quality, particularly in port cities e.g. Hamburg. While detailed data on ship movements and their emissions is challenging to obtain, publicly available open data on air pollution and environmental factors like wind direction and speed has provided valuable insights. To better understand the environmental impact of various ship types, more specific information on ship movements, fuel usage, and resulting emissions is needed.
As a next step, the project team recommends to collaborate with the Hamburg Port Authority and the city of Hamburg is to explore data-sharing opportunities and furthermore support evidence-based policy development aimed at reducing harbor-related air pollution.
Methods and Insights
The project began with a worldwide search for databases on air quality. During this research, the project team became aware of the issue of the impairment of air quality in port cities by ship exhaust fumes. In the further course of the project, the focus was on the case study in the Port of Hamburg. As a showcase, the data from July 2 to 4, 2025 was extracted and processed at three times during the day (10 am, 3 pm, 8 pm). Apart from that a stakeholder analysis was conducted.
In order to analyze the air pollution caused by shipping traffic in the Port of Hamburg, data on ship movements was extracted from the “MarineTraffic” website. Using the developer tools, the data was exported into a CSV format and processed further. A heat map was used to display the hotspots of the ships. The air quality data was color-coded (red = worst, green = best), the wind was represented by the direction of movement and different speeds.
After processing the own data, the findings of various studies on pollution, the different pollutants and the effects on port cities were analyzed. The webpage is a tool to inform potentially affected and interested people about the issue and provide real-time insights into air quality.
Challenges
A major problem was data availability and data extraction. Looking to the future, the ultimate goal is to combine different data from real life in order to be well informed at all times. To achieve this goal, the connection to different databases must be guaranteed.
The absence of localized, real-time data on peak pollution times and locations makes it difficult for policymakers and citizens to respond effectively (Sorte et al., 2020).
The AIREA project highlights the need for a network of air quality sensors and the integration of this data with AIS ship tracking systems to enable targeted recommendations.
Sorte, S. et al. (2020): Impact of harbour activities on local air quality: A review, Environmental Pollution, 2020 https://doi.org/10.1016/j.jtrangeo.2024.104099
Jonson, J. E. et al.(2020): Effects of global ship emissions on European air pollution levels, Atmos. Chem. Phys., 20, 11399–11422, https://doi.org/10.5194/acp-20-11399-2020
Air pollution(n.d.): EEA - European Environment Agency, https://www.eea.europa.eu/en/analysis/publications/sustainability-of-europes-mobility-systems/air-pollution?activeTab=fa5ddc49-de8c-412e-8038-4194928658db
List of busiest container ports (n.d.): Wikipedia, https://en.wikipedia.org/wiki/List_of_busiest_container_ports
Bundesamt für Seeschifffahrt und Hydrographie. (n.d.). Ship emissions: In coastal areas and port cities, ship exhaust gases pollute the air. Retrieved July 6, 2025, from https://www.bsh.de/EN/TOPICS/Shipping/Environment_and_shipping/Ship_emissions/ship_emissions_node.html